- Market Twists & Turns
- Posts
- What Happened to King Dollar?
What Happened to King Dollar?
US Dollar Special
Hey Market Timer!
Stop Missing Out on Market Opportunities: Get 95% Off Your First 3 Months of Market Twists & Turns Pro!
Unlock exclusive insights and expert analysis to maximize your investment returns. For a limited time, get 95% off for your first 3 months and see how our premium content can help you profit in any market.
*Please be advised that this subscription will automatically renew. This subscription renews at the full price after the end of the promotion period. Cancellation is the responsibility of the subscriber.
Today we will be covering...
We have noticed the possibility of reversals in the US Dollar and multiple forex pairs. Today and the next two weeks, we will start covering several of the most interesting USD and EUR forex pairs.
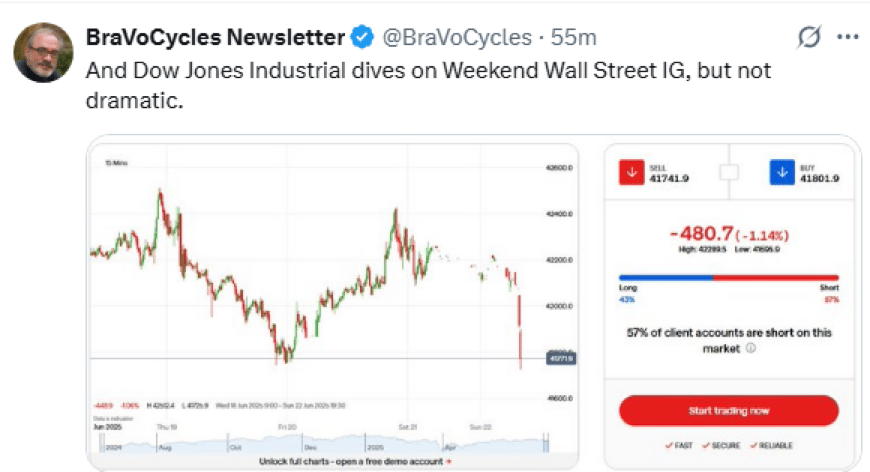
As of Saturday evening EST, the US bombed three Iranian Nuclear sites.
Dow Jones Industrials dived about 1% so far, nothing dramatic, on Weekend Wall Street IG.
If Iran does not respond or responds symbolically by striking some US base, the stock market may bounce from the dip.
Things could get more complicated if Iran closes the Strait of Hormuz or if there is a mutual escalation.
We shall see, we have Sunday before the market opens on Monday, many things could happen by then.

US Dollar Sentiment
Negative views on the U.S. Dollar:
9% YTD drop (NYT, Investopedia).
De-dollarization fears (U.S. News).
The dollar is having its worst year in the 21st century (X post), …
These examples illustrate a negative sentiment toward the US Dollar.
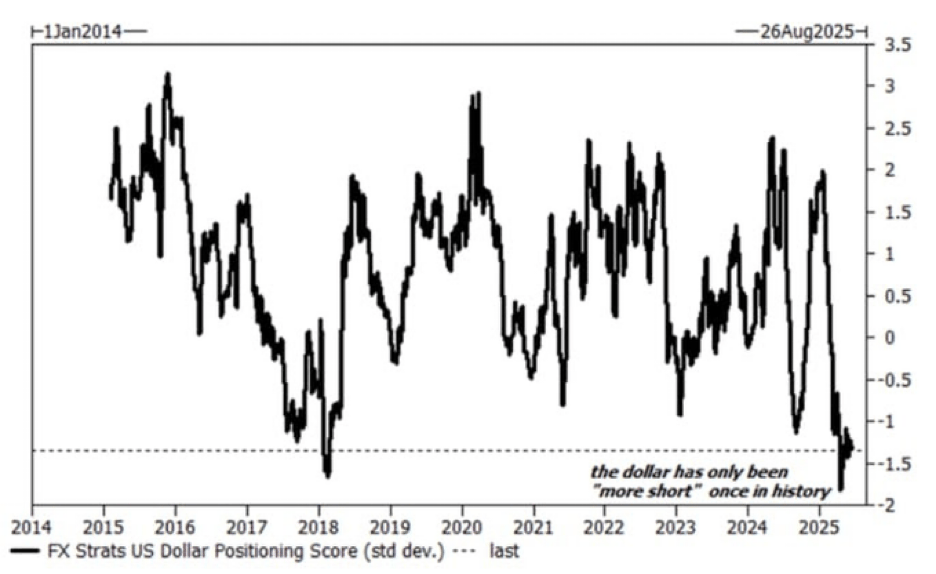
A more telling reflection of the negative sentiment is the extreme short position in the US Dollar shown below.
Although this chart does not suggest when the dollar will reverse its downtrend, one can expect a violent short covering once the trend has reversed.
US Dollar Index (DXY) – Part 1
Reposts from a recent Pro newsletter:
DXY satisfied all downside cycle price projections, but it still has downside room within its 3.5-year cycle projection (left).
However, there is a good chance it will find support at the 7-year cycle FLD (forward line of demarcation).
To understand cycle price projections charts, please read the educational materials (educational resources | Market Twists & Turns) lessons: 1. Price Projections Using FLDs, and 2. Price Projection Method 2.
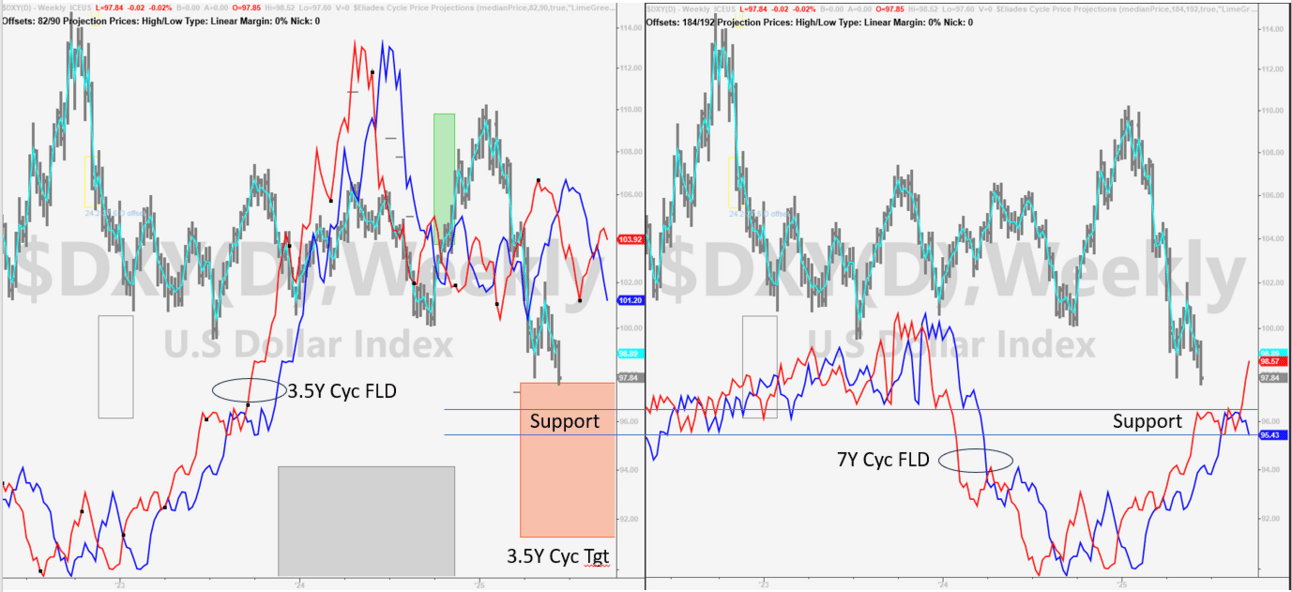
Both daily and weekly chart cycle composites suggest that DXY is due for a bounce.

Sentiment & Technical Analysis
The CNN’s Fear & Greed Index improved to 55, almost to Greed, despite a largely negative stock market day.
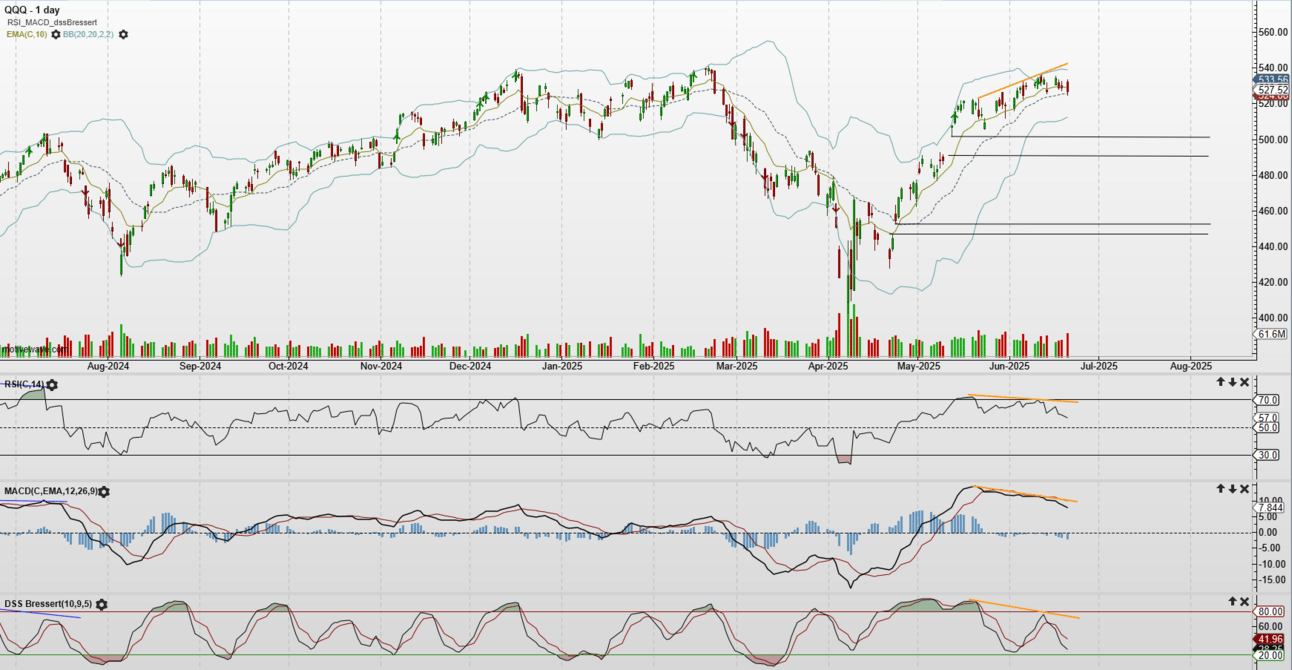
QQQ had an outside reversal day on Friday.
Many technicians consider this candle bearish, but often there is no bearish continuation.
I give it less weight in a headlines-driven market.
Negative divergences in technical indicators suggest a possibility of a correction. Though keep in mind that a bullish geopolitical headline can cause a pop higher and invalidate these negative divergences.
Note also the unfilled gaps. They will most likely be filled, but the 64K question is when. Before or after NDX makes a higher high?
BraVoCycles on X
Consider following me on X (former Twitter) in addition to the newsletter, as I often post valuable information there in real time between the newsletters.
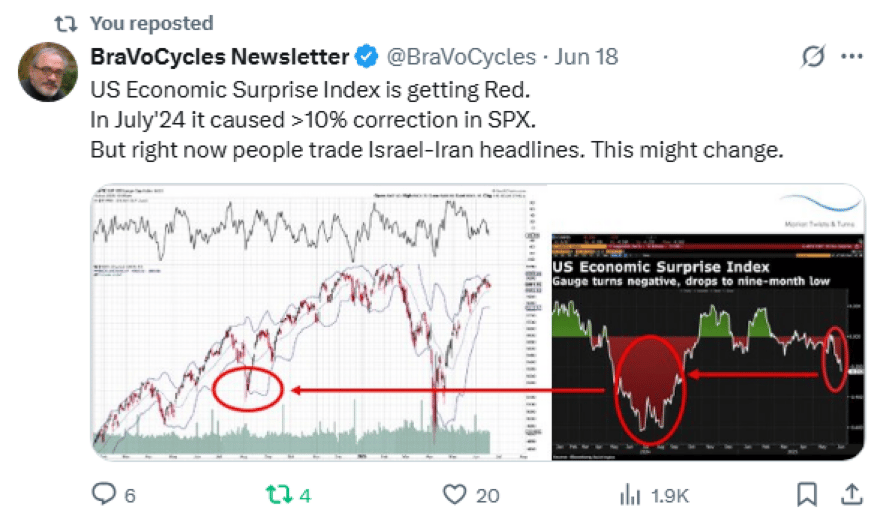
To continue reading about Market Summary, US Markets, Elliott Wave and Technical analysis of US Markets, volatility, as well as commodities, bonds, forex, currencies or crypto, upgrade to Premium Pro. . .
Subscribe to the Pro Tier to read the rest.
Become a paying subscriber of Market Twists & Turns - Pro to get access to the rest of this post and other subscriber-only content.
Already a paying subscriber? Sign In.
A subscription gets you:
- • In-depth analysis & analysis multiple times/week on SPX, NDX, DJI, RUT, VIX/VXX, plus
- • Bonds, commodities, forex, international markets, select stocks, & EFTs
- • Technical & Elliott Wave Analysis (EWA)
- • Price projections using Cycle methods and Fibonacci levels
- • Ad-free & downloadable pdf version


Reply