- Market Twists & Turns
- Posts
- Stock Market Top – Are We There Yet?
Stock Market Top – Are We There Yet?
Are Tariff Letters Going To Be a Monkey Wrench in July?
BraVoCycles Newsletter
July 13, 2025
Hey Market Timer!
Stop Missing Out on Market Opportunities: Get 95% Off Your First 3 Months of Market Twists & Turns Pro!

Unlock exclusive insights and expert analysis to maximize your investment returns. For a limited time, get 95% off for your first 3 months and see how our premium content can help you profit in any market.
*Please be advised that this subscription will automatically renew. This subscription renews at the full price after the end of the promotion period. Cancellation is the responsibility of the subscriber.
Today we will be covering...

Today, we will examine the NAAIM Index and its relation to the S&P 500.
We will also have a crypto special in the Pro newsletter.
President Trump sent 30% tariff letters to Europe and Mexico. Perhaps the stock market seasonality will work.

NAAIM Index
The NAAIM (National Association of Active Investment Managers) Index* Update as of Wednesday this week.
Managers started to pull in their horns.
The NAAIM Index usually peaks slightly before, or coincidentally with, the S&P 500.
My expectations for future trajectories of the NAAIM Index and SPX have been added.
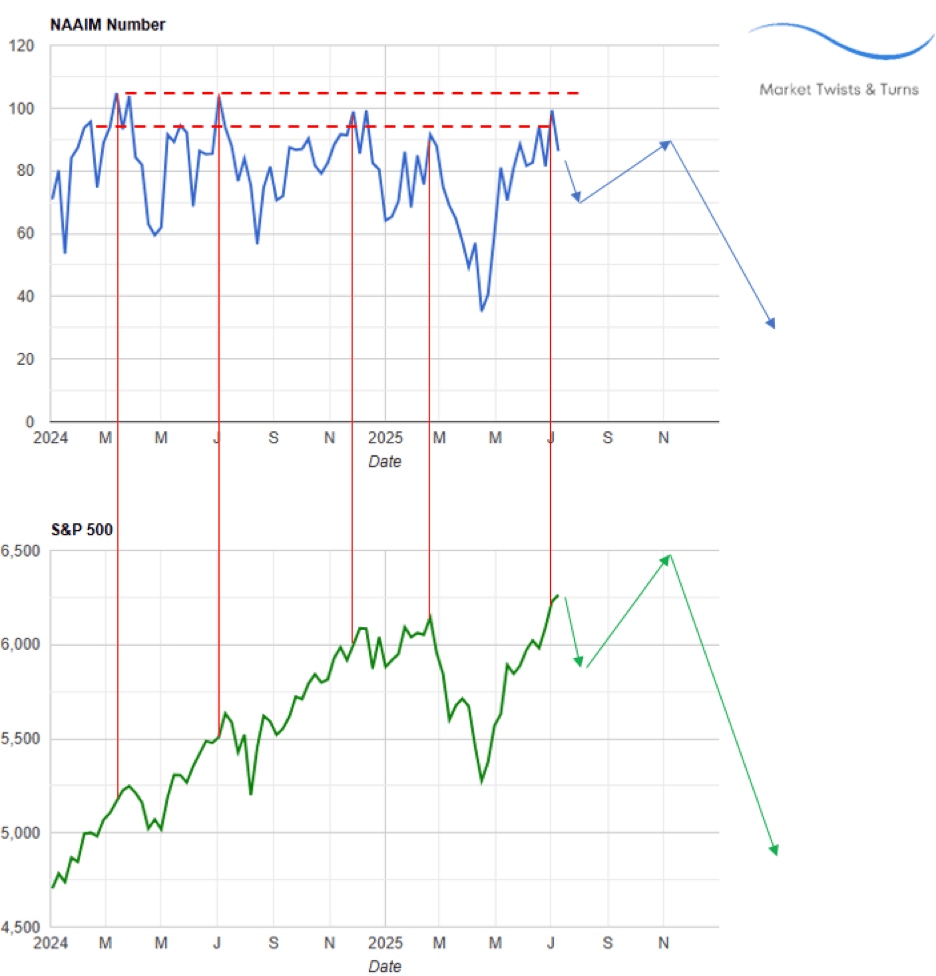
*The NAAIM Index is a weekly sentiment indicator that reflects the average equity exposure of active investment managers in the US stock market. It's calculated by surveying NAAIM members about their current equity allocations, which can range from 0% (fully in cash) to 200% (fully leveraged long). The index is used as a contrarian indicator, with high readings potentially signaling overbought conditions and low readings potentially signaling oversold conditions.
Sentiment & Technical Analysis
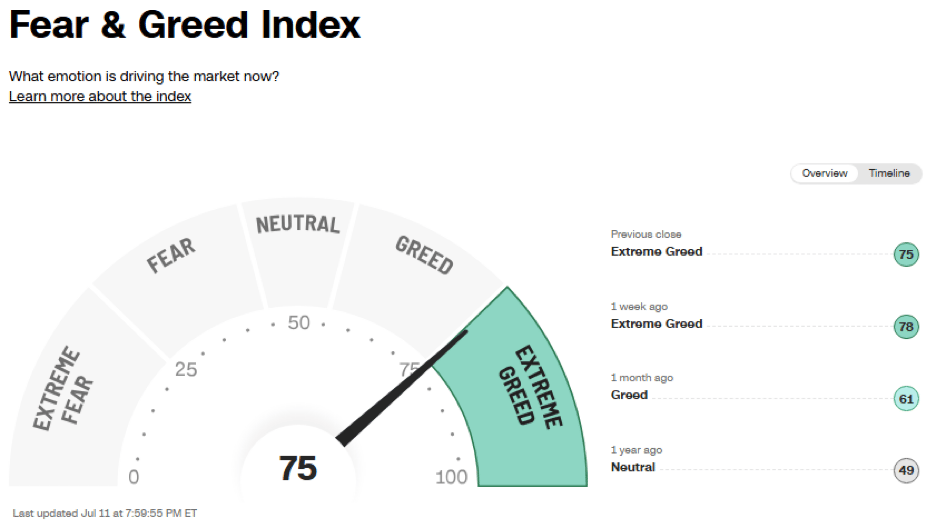
The CNN’s Fear & Greed Index remains in Extreme Greed, just barely.
QQQ, the NDX ETF, shows signs of losing momentum and a potential topping, at least in the short term.
Consider the QQQ advance of about 9% since late May.
RSI has been negatively diverging.
The volume has been declining.
MFI has been negatively diverging.
None of these favor the bullish case in the short term.

BraVoCycles on X
Consider following me on X (former Twitter) in addition to the newsletter, as I often post valuable information there in real time between the newsletters.

To continue reading about Market Summary, US Markets, Elliott Wave and Technical analysis of US Markets, volatility, as well as commodities, bonds, forex, currencies or crypto, upgrade to Premium Pro. . .
Subscribe to the Pro Tier to read the rest.
Become a paying subscriber of Market Twists & Turns - Pro to get access to the rest of this post and other subscriber-only content.
Already a paying subscriber? Sign In.
A subscription gets you:
- • In-depth analysis & analysis multiple times/week on SPX, NDX, DJI, RUT, VIX/VXX, plus
- • Bonds, commodities, forex, international markets, select stocks, & EFTs
- • Technical & Elliott Wave Analysis (EWA)
- • Price projections using Cycle methods and Fibonacci levels
- • Ad-free & downloadable pdf version
Reply