- Market Twists & Turns
- Posts
- Stock Market Still Pushing Higher
Stock Market Still Pushing Higher
How Much More Bullish Fuel in the Tank?
BraVoCycles Newsletter
July 27, 2025
Hey Market Timer!
Stop Missing Out on Market Opportunities: Get 95% Off Your First 3 Months of Market Twists & Turns Pro!

Unlock exclusive insights and expert analysis to maximize your investment returns. For a limited time, get 95% off for your first 3 months and see how our premium content can help you profit in any market.
*Please be advised that this subscription will automatically renew. This subscription renews at the full price after the end of the promotion period. Cancellation is the responsibility of the subscriber.
Today we will be covering...

Today, we will examine bonds, starting with the relation between the FED funds rate and the 2-year Treasury Yields as determined by the market forces.
In the Pro newsletter, we will examine TLT and 10Y Treasury Notes yield.
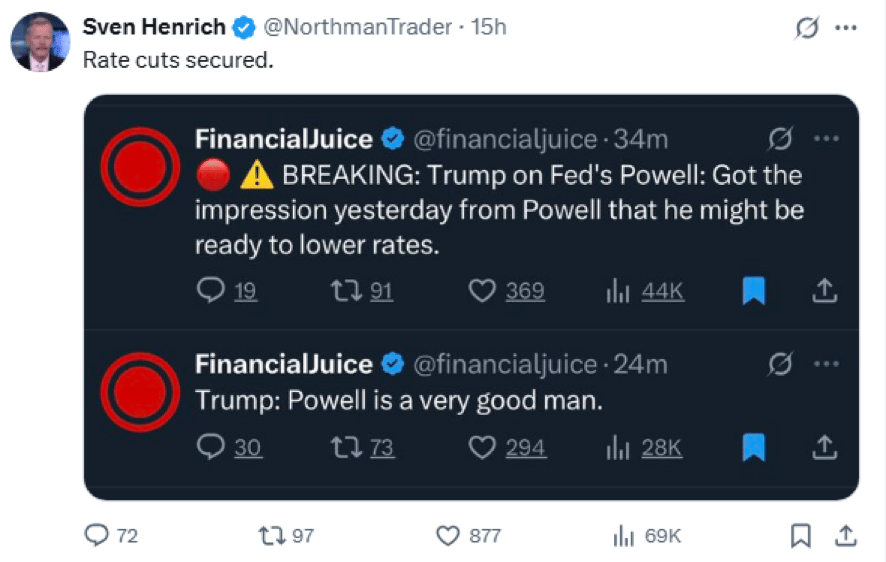
After visiting the FED, Trump thinks Powell might cut rates.
Will the FED Cut Rates?
Pundits keep pondering whether the FED will cut the FED funds rate and what would be the impact on the financial markets.
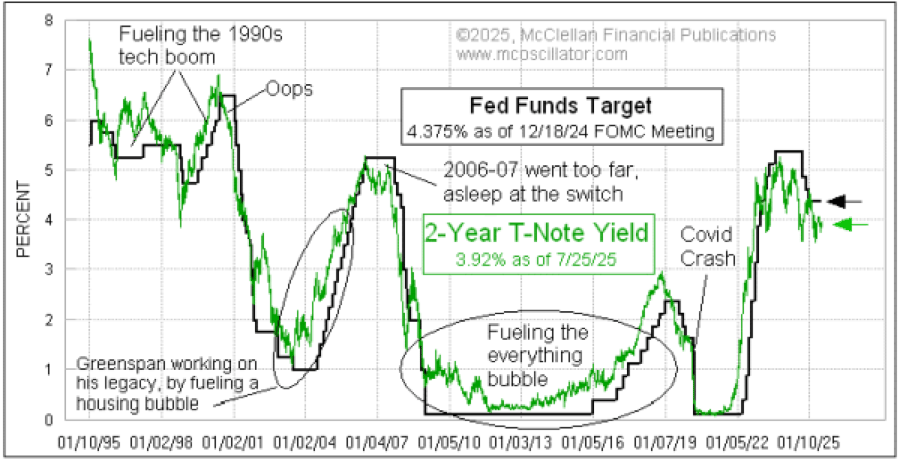
Last year, I posted a chart that showed that the FED follows the market rates, not the other way around.
Today I received the chart below showing the FED funds target and the 2-year Treasury Yields as determined by the market.
It is clear that the FED is a follower, not a leader, regarding the yields.
What is the takeaway? To determine what the Fed will do, observe how much it is behind the 2-year Treasury yields.
Sentiment & Technical Analysis
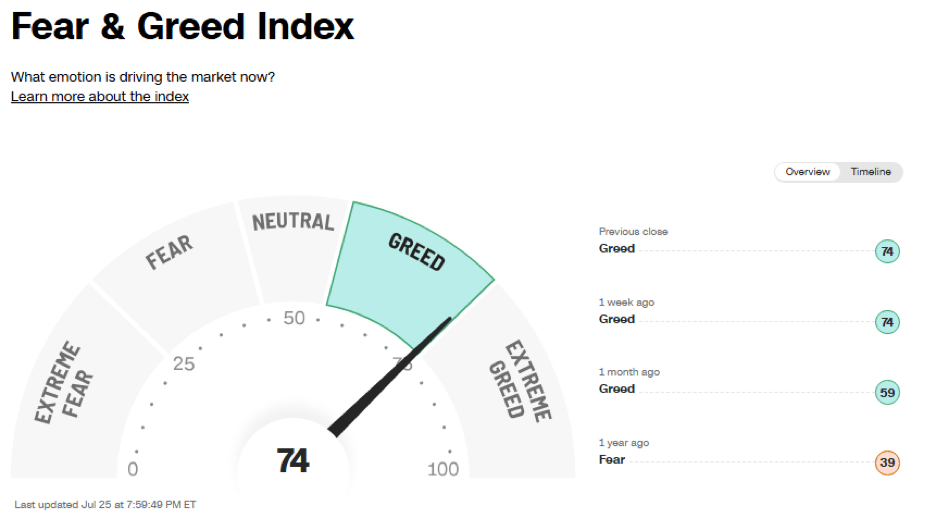
The CNN’s Fear & Greed Index (FGI) has held steady between Greed and Extreme Greed. By itself, the FGI suggests caution, but it is not extreme enough for a contrarian bet to sell.
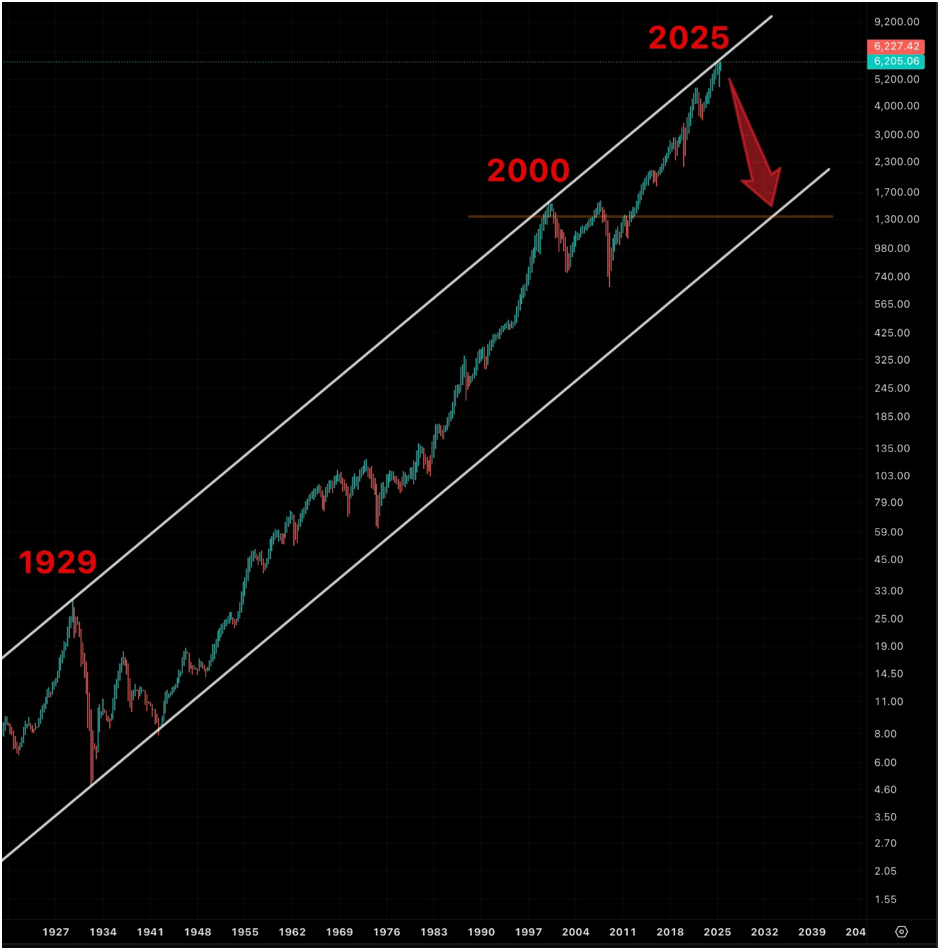
This is a chart for financial history books. Pay attention.
S&P 500 (SPX) is hitting a long-term trendline resistance connecting 1929 and 2000 stock market bubble peaks.
SPX is tagging this resistance now.
What is remarkable is that the Buffett Indicator is the highest ever right now, i.e., the stock market is the most overvalued ever by this metric.
Bulls say, SPX will break/slice through resistance.
Bears say, SPX will be rejected, and this will mark one of the most significant market tops.
In reality, resistance and support lines can be tagged multiple times before they are broken or reject the price of the instrument decisively.
For example, SPX can pull back from resistance, then make another attempt higher and tag it again.
BraVoCycles on X
Consider following me on X (former Twitter) in addition to the newsletter, as I often post valuable information there in real time between the newsletters.
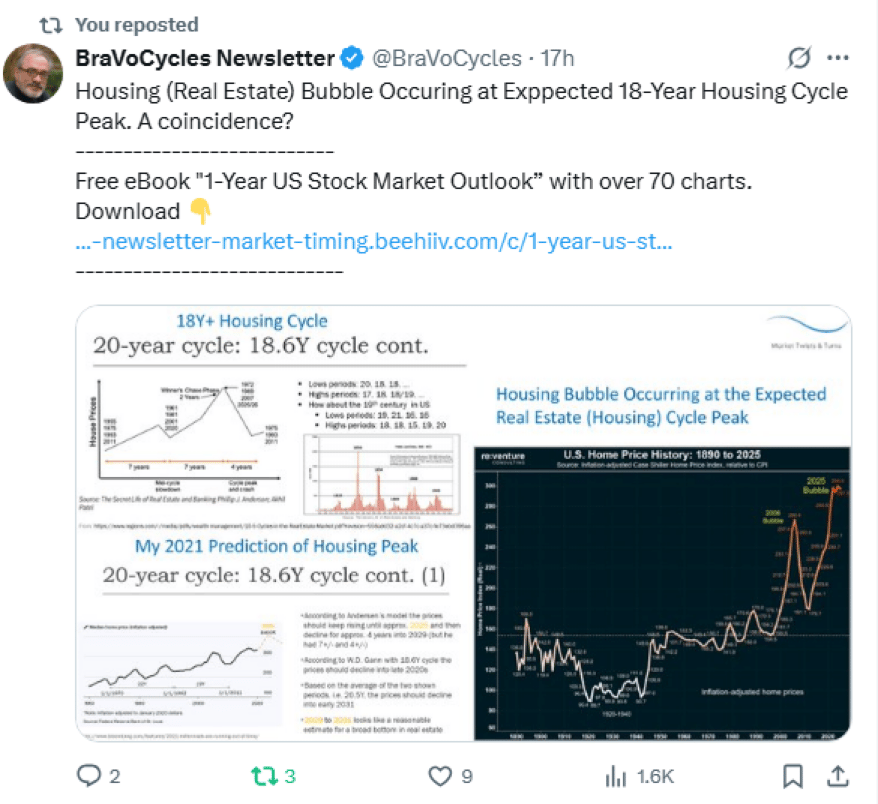
The 18-19-year cycle is very important in the financial market, and notably in real estate.
The two slides on the left are from my slide deck of 3-4 years ago.
In the bottom left slide, I predicted that the home prices will peak in 2025, based on this cycle.
Thus, we are in the peak range, and +/-10% of the cycle period should be allowed for margin of error, i.e., tolerance.
What is interesting is that the chart on the right shows that inflation-adjusted home prices are at a historic record, while the home-buying affordability (not shown in the X post) is at about the lowest levels in 30-35 years, based on the data I have seen.
This combo could lead to lower home prices, and if the economy gets worse in the next several years, the home prices could drop significantly.
Hopefully, a possible drop will not be dramatic, but after the 2006 real estate bubble, the home prices did drop dramatically.
To continue reading about Market Summary, US Markets, Elliott Wave and Technical analysis of US Markets, volatility, as well as commodities, bonds, forex, currencies or crypto, upgrade to Premium Pro. . .
Subscribe to the Pro Tier to read the rest.
Become a paying subscriber of Market Twists & Turns - Pro to get access to the rest of this post and other subscriber-only content.
Already a paying subscriber? Sign In.
A subscription gets you:
- • In-depth analysis & analysis multiple times/week on SPX, NDX, DJI, RUT, VIX/VXX, plus
- • Bonds, commodities, forex, international markets, select stocks, & EFTs
- • Technical & Elliott Wave Analysis (EWA)
- • Price projections using Cycle methods and Fibonacci levels
- • Ad-free & downloadable pdf version
Reply