- Market Twists & Turns
- Posts
- Stock Market Rug Pull
Stock Market Rug Pull
Tariff News Pulled Rug Underneath Overbought Market
Hey Market Timer!
For the month of February we are sharing the love with an exciting new promotion.
Unlock Exclusive Insights for Pennies: 95% Off Your First 3 Months!
Tired of missing out on the latest trends and insider knowledge? For a limited time, subscribe to Market Twists & Turns Pro and get a whopping 95% off your first three months! That's right, you'll gain access to our premium content, in-depth analysis, and expert opinions for a fraction of the regular price. This will give you an opportunity to truly see what our Premium Pro content is like and reap the benefits.
Today we will be covering...
We are truly grateful for your engagement with sponsored ads. Your support is crucial for us to continue publishing the free newsletter.
We’d like to take a break in our “regularly scheduled programing” with a sponsored message.
Smart Investors Are Betting On A.I. Stocks—Are You?
Experts say Trump’s $500B A.I. investment plan could transform the industry.
Meanwhile, a small but ambitious A.I. healthcare company just went public after eight years of innovation, securing $18M in funding and partnering with industry giants.
With a $120M market cap and shares still under $2, this stock may not stay cheap for long.
Trump’s tariffs news on Friday caused the second rug pull last week
Today, we will look at VALE. It is a genuine value stock. The trailing and Forward (estimated) P/E are 4.3 and 4.7, respectively. The P/S and P/B are 0.97 and 1.04, respectively.
Nice, but is the decline in VALE price over?
We will explore what different technical analysis methods say.
VAL[U]E Investing – VALE
VALE Then
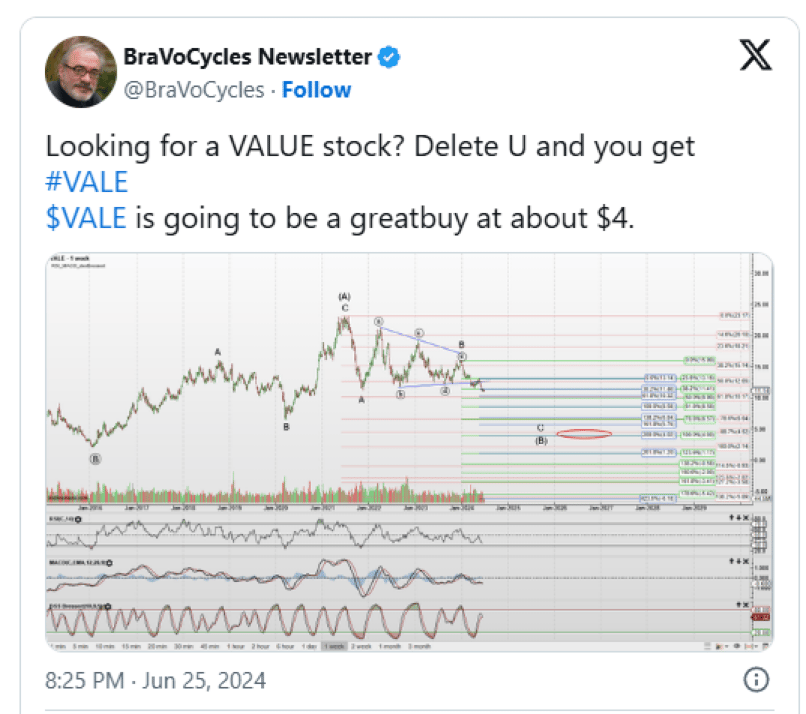
On 27 June, I posted the VALE chart below after the break of the bearish triangle B.
I also flagged the ideal target of about $4, which corresponds to C=A and 88.7% retrace of wave (A).
VALE Now
Does VALE must go to the ideal target of $4?
No, it does not. Other acceptable targets are 61.8% and 78.6% red retrace fibs of (A).
61.8% is already broken, 78.5% is interesting as it coincides with (C) equal to Fibonacci 0.786 of (A), support (orange line) from B of (A)!
However, the weekly trend is still down: 1. Inside pink & black channels, and 2. Below down-trending 10W EMA, 50W, 100W and 200W MAs.
Technical indicators are not showing a convincing positive divergence.
Once VALE bottoms in (B), it should target 25 or higher in wave (C). The exact target is TBD.
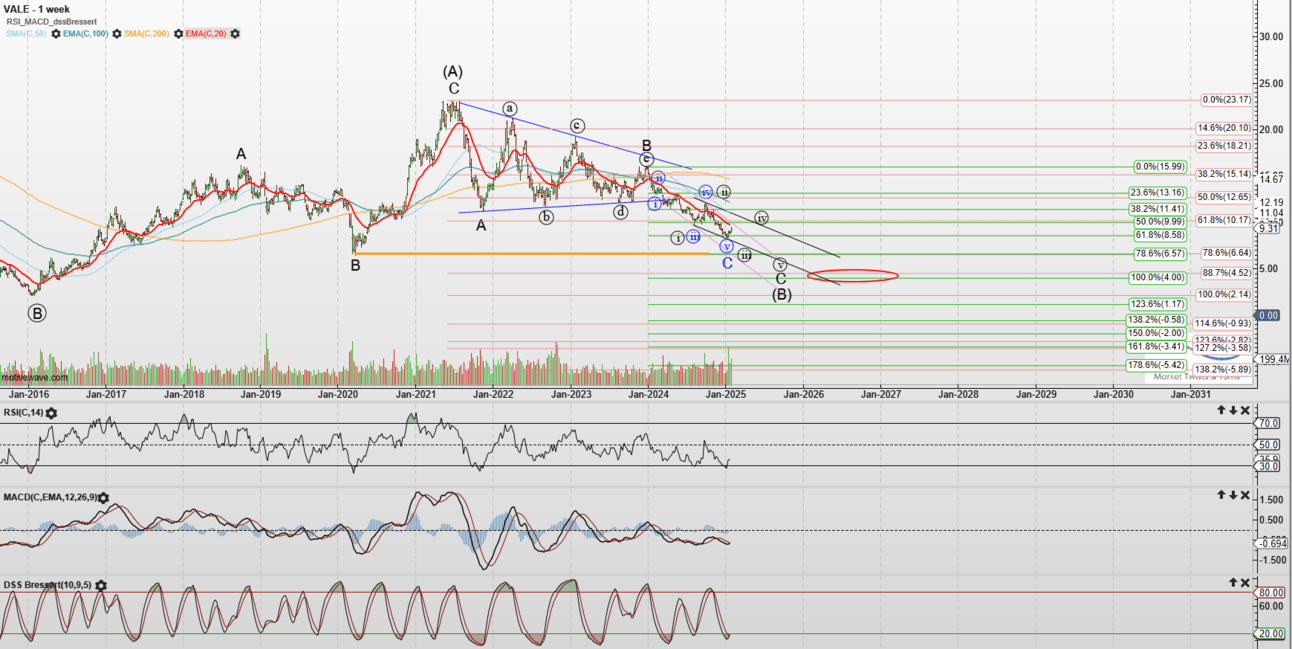
The chart above shows two plausible Elliott Wave (EW) counts, blue and black.
The blue count is less likely, given the abovementioned technical factors.
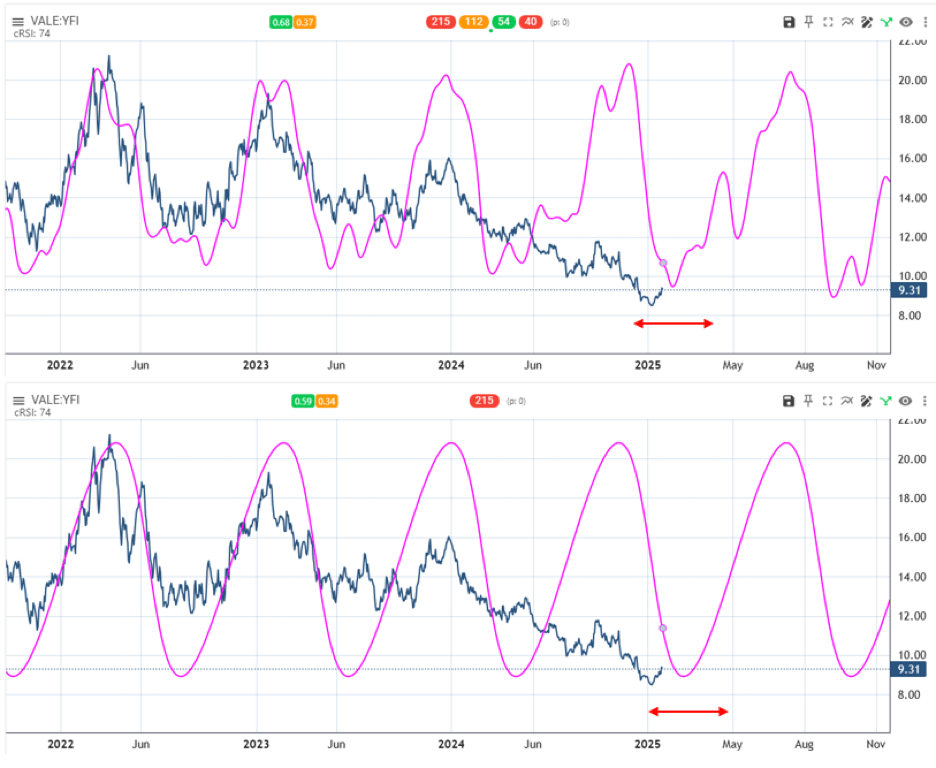
The daily cycle composite (upper window) comprising four dominant cycles detected on the daily chart suggests a cycle bottom in mid-Feb.
The daily cycle composite is dominated by the 40-week cycle (lower window) with an expected trough at the end of Feb.
The red double arrows signify that one shall always provide for a tolerance of 10-15% of the length of the dominant cycle. The reasons are: 1. Not all shorter and longer cycles are captured, 2. Cycles are dynamic in that their attributes vary over time, and 3. There is some estimation/measurement error.
The pending cycle trough may not correspond to the final low.
For example, if it is the low of (B), the next peak and trough may correspond to waves ((i)) and ((ii)) of wave (C) up.
Alternatively, the next peak and trough may correspond to waves ((iv)) and ((v)) of C of (B) in the black EW count.
Our methodology in Market Twists & Turns incorporates multiple methods to accurately identify turning points: technical analysis, Elliott Wave Theory, cycles turning points, and cycle price projections.
WE will look at VALE cycle price projections in the Premium content.
Sentiment & Technical Analysis
The Fear & Greed Index is hovering just above the fear range. It is not providing much insight currently.
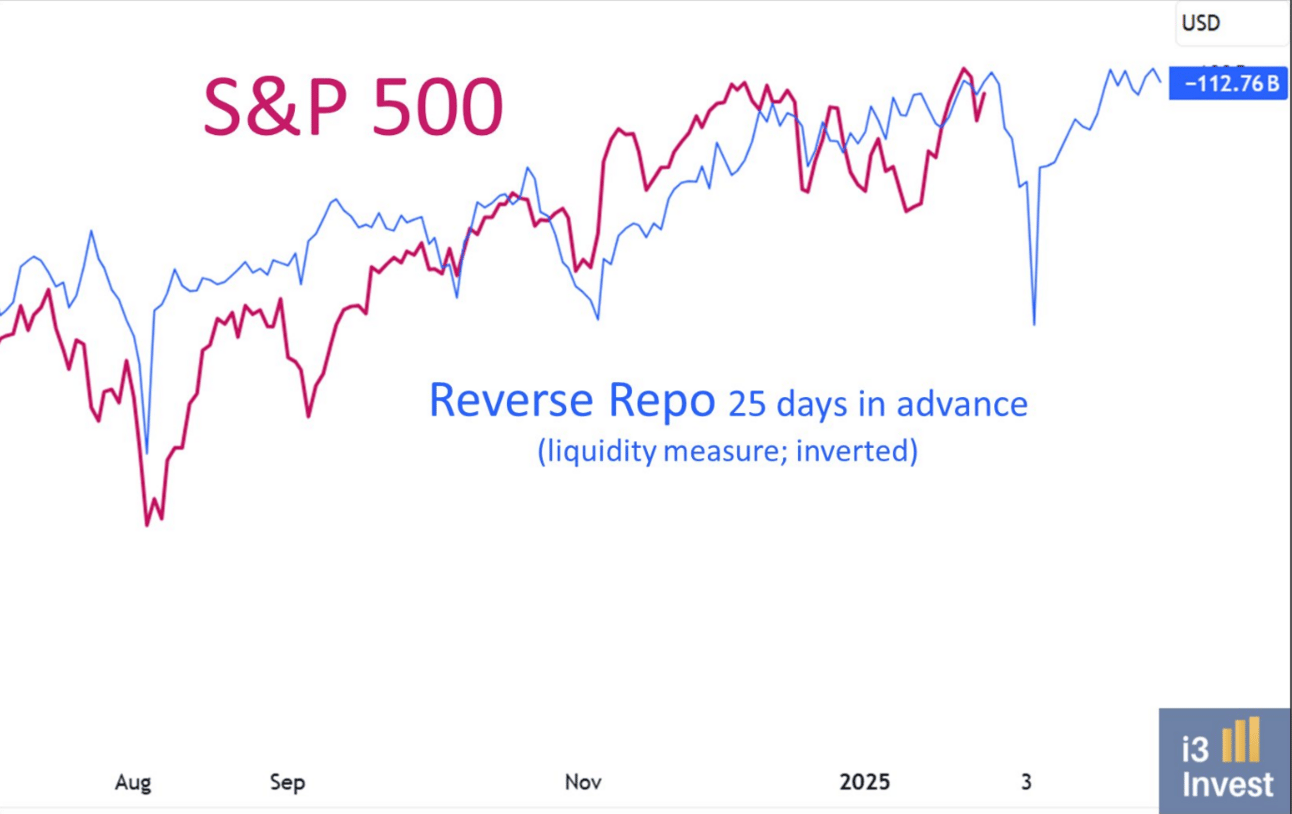
Liquidity provided by the FED is still in a downtrend, technically speaking.
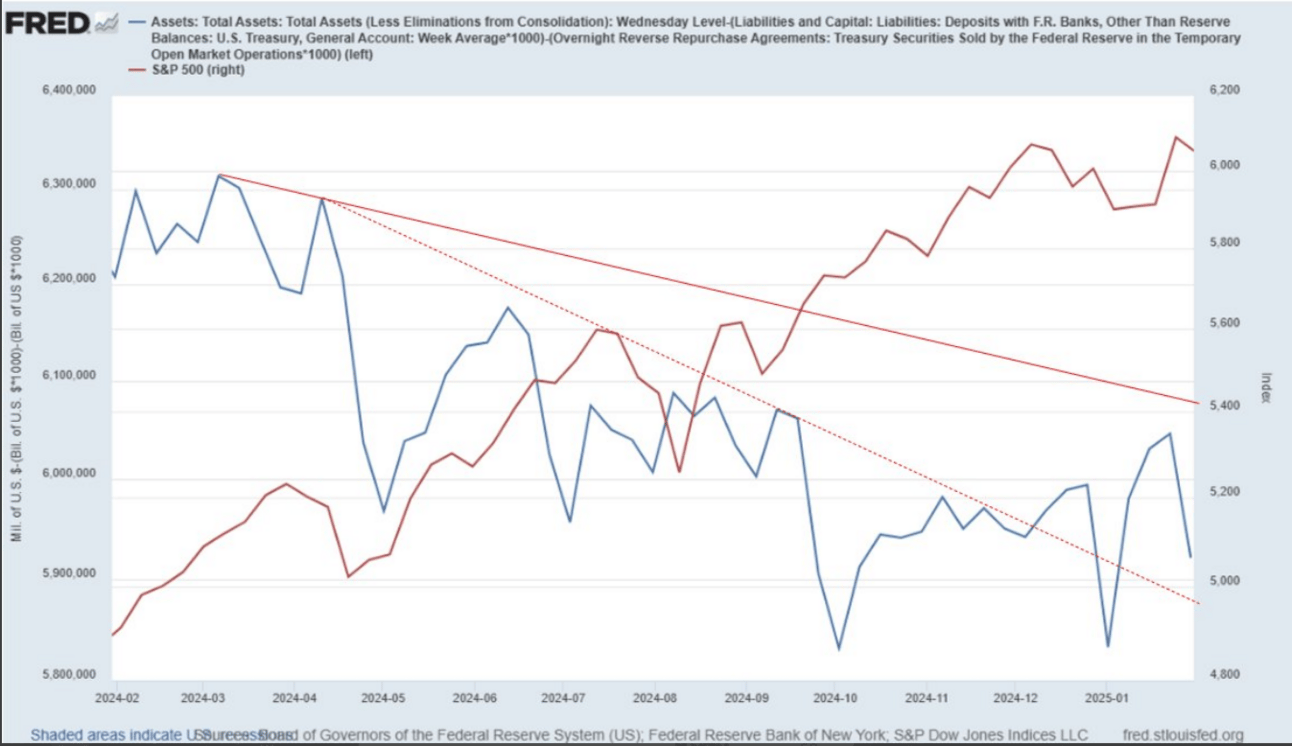
There is an interesting correlation between S&P 500 and Liquidity with a 25-day offset.
Consider following me on X (former Twitter) in addition to the newsletter, as I often post valuable information there in real time between the newsletters.
What is Warren Buffet doing?
"Brand New Bull Market"? 🤣
Warren Buffet was selling stocks and raising cash big time in 2024 (see chart).
What was he doing with cash? Berkshire increased T-Bills holdings 81% by Jun'24 wrt 2023.
It now owns more T-Bills than the FED!— BraVoCycles Newsletter (@BraVoCycles)
6:25 PM • Jan 30, 2025
To continue reading about Market Summary, US Markets, Elliott Wave and Technical analysis of US Markets, volatility, as well as commodities, bonds, forex, currencies or crypto, upgrade to Premium Pro. . .
Smarter Investing Starts with Smarter News
The Daily Upside helps 1M+ investors cut through the noise with expert insights. Get clear, concise, actually useful financial news. Smarter investing starts in your inbox—subscribe free.
Subscribe to the Pro Tier to read the rest.
Become a paying subscriber of Market Twists & Turns - Pro to get access to the rest of this post and other subscriber-only content.
Already a paying subscriber? Sign In.
A subscription gets you:
- • All the benefits of our Free and Basic tiers, plus
- • Ad free
- • Downloadable pdf version of the full length newsletter
- • Updates and opportunities 4-5x/week on
- • Individual major stocks and ETFs
- • International markets, forex, cryptocurrencies, bonds and commodities
- • All featuring advanced cycle methods for market timing with expert Elliott Wave and technical analysis, and more...


Reply