- Market Twists & Turns
- Posts
- Stock Market Did Not Like PPI
Stock Market Did Not Like PPI
Initial Pop After PPI Release Was Sold
BraVoCycles Newsletter
September 11, 2025
Hey Market Timer!
Stop Missing Out on Market Opportunities

Get 95% Off Your First 3 Months of Market Twists & Turns Pro!
Unlock exclusive insights and expert analysis to maximize your investment returns. For a limited time, get 95% off for your first 3 months and see how our premium content can help you profit in any market.
*Please be advised that this subscription will automatically renew. This subscription renews at the full price after the end of the promotion period. Cancellation is the responsibility of the subscriber.
What's Inside...

Today, we will focus on Nvidia and the Semiconductor Sector.
PPI numbers were weaker than expected:
PPI -0.1% MoM, Exp. 0.3%
PPI Core -0.1% MoM, Exp. 0.3%
PPI 2.6% YoY, Exp. 3.3%
PPI Core 2.8% YoY, Exp. 3.5%
There was a huge Jobs Surprise on Friday: U.S. AUGUST NONFARM PAYROLLS RISE BY 22,000; EST. 75,000; PREV. 79,000. Plus, huge revisions of last year's job reports.

Weak jobs and weaker inflation may trigger some stagflation thinking among investors. I have no strong opinion about stagflation, though.
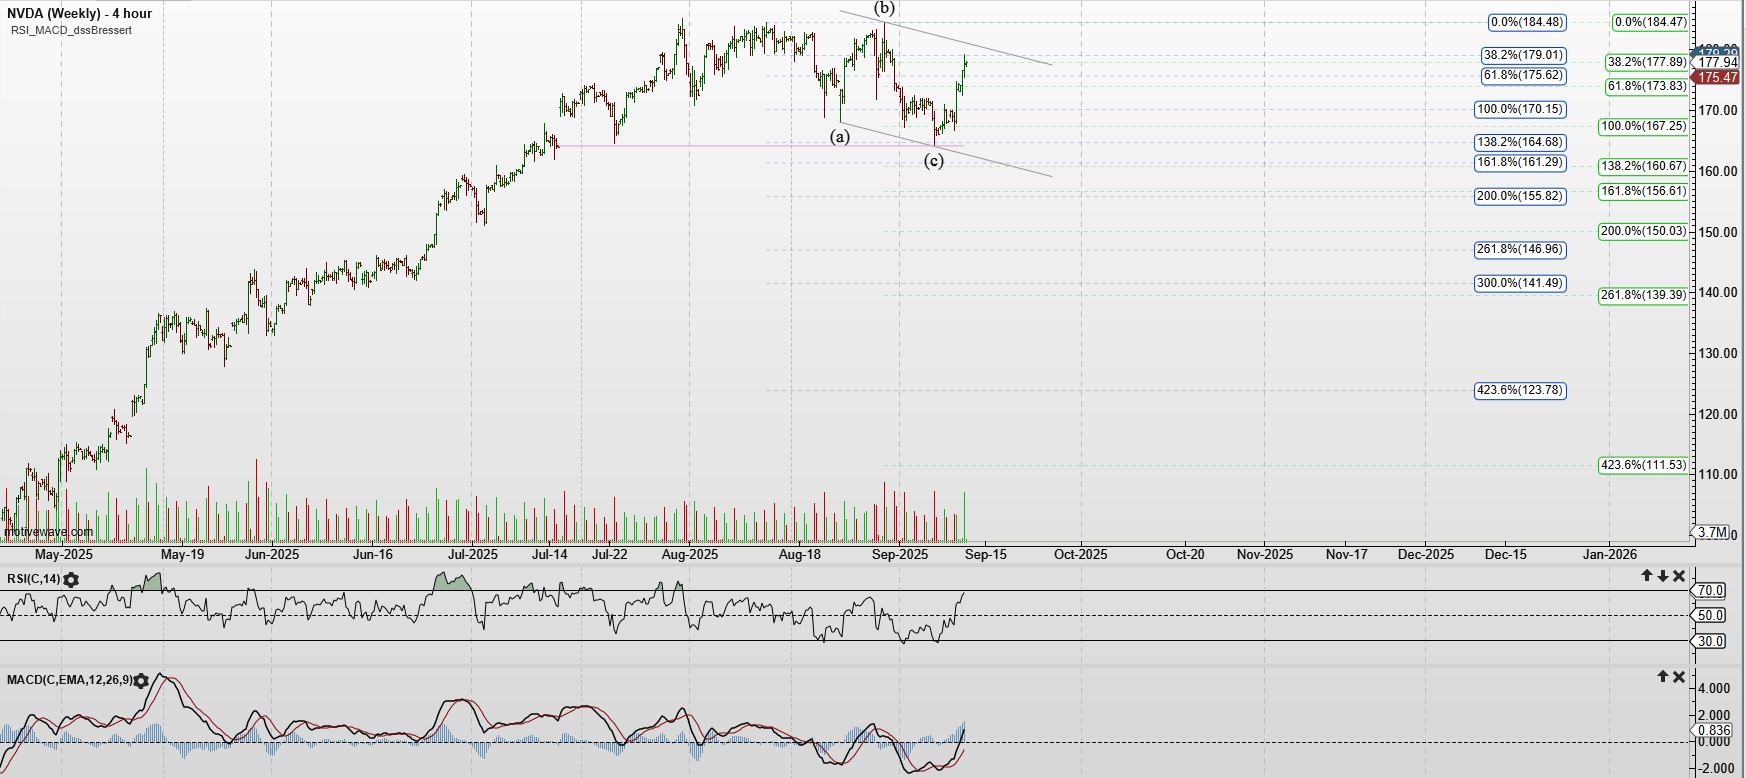
Nvidia (NVDA)
Did Nvidia (NVDA) peak?
The drop from the late July high looks like a nice (a)-(b)-(c) down, suggesting another high to come.
There is a smaller probability that what looks like an (a)-(b)-(c) down is a developing leading diagonal (down), but it is too early to speculate on that.
Shorter-term cycles, from 15 to 88 trading days, suggest an upside bias into December.
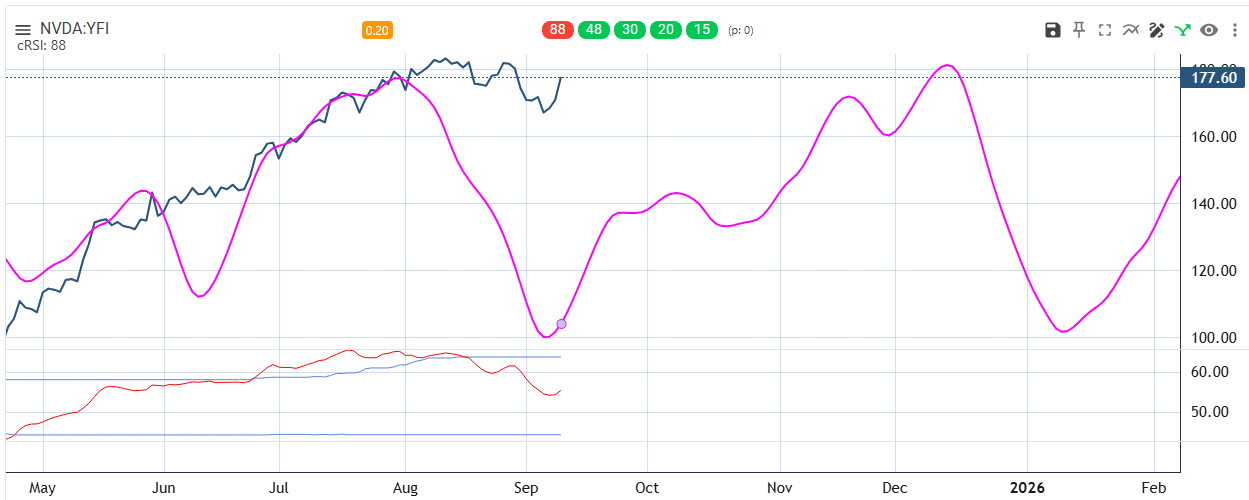
The three strongest and longest cycles detected on the daily chart have peaked.

We will look at the semiconductor index in the Pro newsletter.
Unlock exclusive market insights with BraVoCycles’ Premium Reports on Gumroad!
We just released brand new Special Reports on Bitcoin, Ethereum and Apple.
As a Market Twists & Turns subscriber, enjoy 40% off all reports using code MARKETTWISTSTURNS40 at checkout.
We will be adding additional reports on cryptocurrencies, international markets and individual stocks soon!
BraVoCycles on X
If you are interested in financial markets, you are missing a lot by not following me on X as I do not have enough canvas space in the newsletter to post all my research in it and which I try to post on X. Also, I often post important real-time updates between the newsletters.
The chart below is yet another view of the weakening internals of the broader stock market.
Note: This chart should not be construed as a short-term sell indicator. It signifies less participation by stocks in the late advance from the April low.


To continue reading about what’s next for the stock market, US Markets, Elliott Wave and Technical analysis of US Markets, volatility, as well as commodities, bonds, forex, currencies and crypto, claim your 95% off for 3 months introductory rate and upgrade to Premium Pro. . .

Most coverage tells you what happened. Fintech Takes is the free newsletter that tells you why it matters. Each week, I break down the trends, deals, and regulatory shifts shaping the industry — minus the spin. Clear analysis, smart context, and a little humor so you actually enjoy reading it.
Subscribe to the Pro Tier to read the rest.
Become a paying subscriber of Market Twists & Turns - Pro to get access to the rest of this post and other subscriber-only content.
Already a paying subscriber? Sign In.
A subscription gets you:
- • In-depth analysis & analysis multiple times/week on SPX, NDX, DJI, RUT, VIX/VXX, plus
- • Bonds, commodities, forex, international markets, select stocks, & EFTs
- • Technical & Elliott Wave Analysis (EWA)
- • Price projections using Cycle methods and Fibonacci levels
- • Ad-free & downloadable pdf version
Reply