- Market Twists & Turns
- Posts
- Market Timing and Price Projections
Market Timing and Price Projections
Weekly Newsletter, December 03, 2023
We are still experiencing a glitch on our platform’s upgrade page.
While we work on resolving this issue with Beehiiv, we are extending our special Founder’s Rate discount of 38% off until further notice.
Table of Contents
Summary
Sentiment Analysis
Cycles X-Rays of Major Indexes
EW Analyses of Major Indexes
Annexes
Commodities Corner
TLT/Bonds
BTCUSD/Crypto
We would love to hear about what you want to see more of. Vote below!
What are your favorite topics for special swing opportunities? |
Summary
An incredible move up from late October, driven likely by short covering and FOMO is starting to show signs of slowing and potential reversal. The sentiment indicators are well in the over-confidence/greed region, which is at least a yellow flag. VIX is at a 5-year low and is approaching pre-COVID levels. Most indexes achieved the targets I have been waiting for but some still have higher targets. In terms of EWT, most indexes are due for a pullback shortly. Cycles also suggest pullbacks into mid-December and mid-January or so, with a “Santa rally” in between. In this extraordinarily long report, we also cover some swing opportunities in commodities, crypto, and bonds.
Sentiment
Sentiment has reached over-confidence levels raising a yellow, if not red flag. Requires caution on the part of investors and traders!
The sentiment indicators are at greedy levels but not at extreme greed yet. A few more days of the market going up could get the sentiment to extreme levels.
AAII bulls approaching Jul’23 levels. Bears are at a 5 year low!
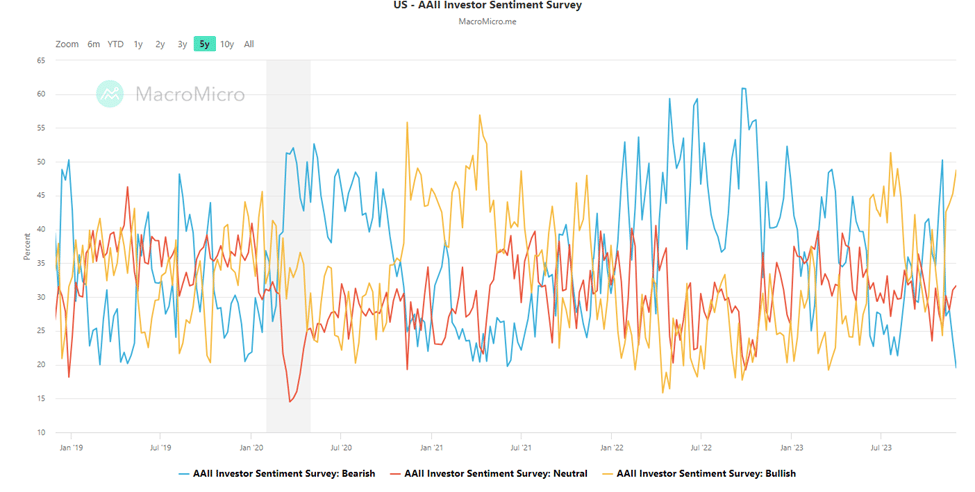
Figure 1 – US AAII bull-bear sentiment survey.
CNN Fear & Greed Index rhymes with the AAII survey, it is in the upper part of the greed region.
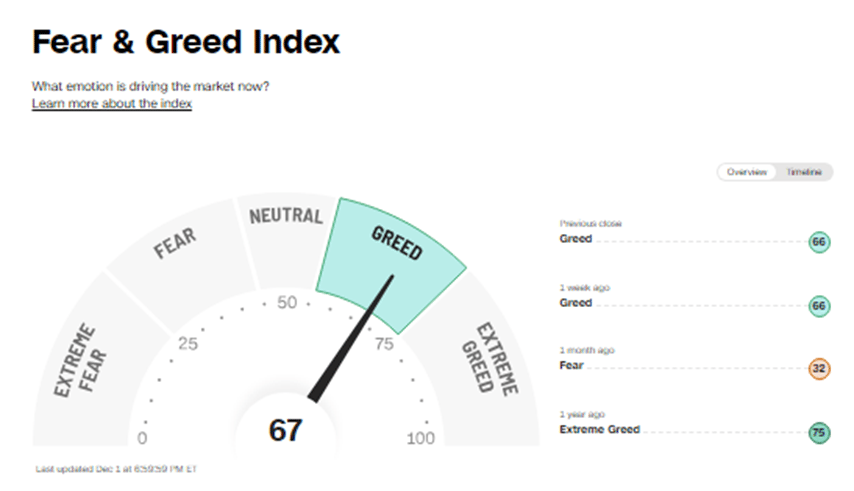
Figure 2 – CNN Greed & Fear Index.
The put-call ratio is in the warning zone (extreme greed) but not yet as low as in Jul’23.

Figure 3 – Put call ratio.
VIX is at a bear market low, if still in the bear market. Approaching pre-COVID extremes.
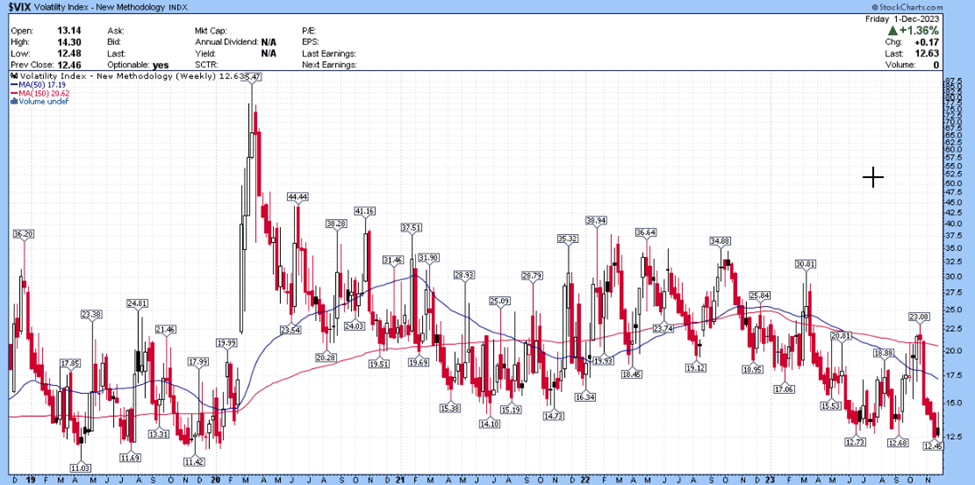
Figure 4 – VIX weekly chart.
A risky asset, Bitcoin crypto entered the over-confidence zone, calling for caution. A review of the popular crypto sites reflects this over-confidence index.
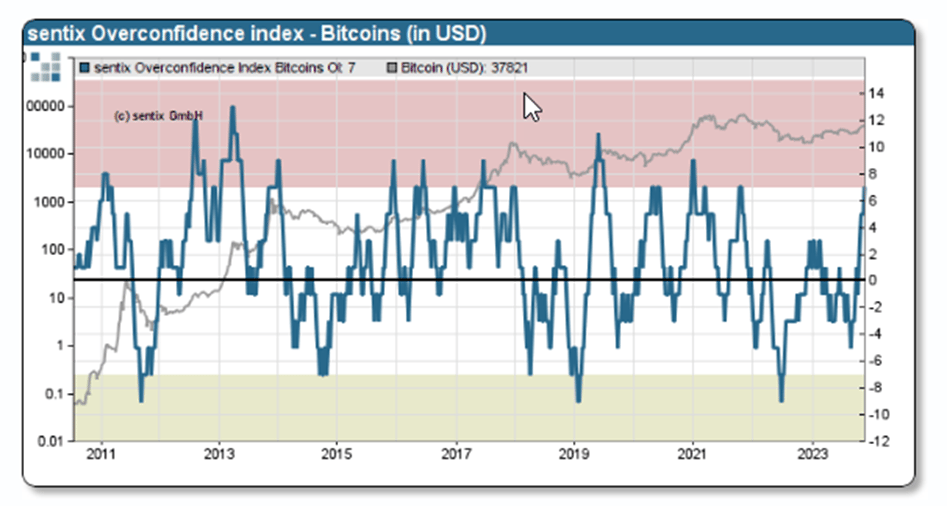
Figure 5 – Bitcoin sentiment
Finally, several days ago, and before, I posted charts showing extreme overvaluation of NDX relative to IWM, DJI, etc. Here is another example/indication that NDX is approaching some extremes. The chart shows that NDX follows closely the balance sheets of global central banks (FED, ECB, BoJ), but this year the correlation completely broke! Is it due to Magnificent 7? In any case, this “alligator mouth” gap should close, and I suspect it will close by NDX correcting significantly in the future. What will be a trigger. I do not know, perhaps a continuation of the bear market and traders/investors simply selling the most overvalued stocks. But it will close, extremes always get corrected, as they say reversion to the mean.
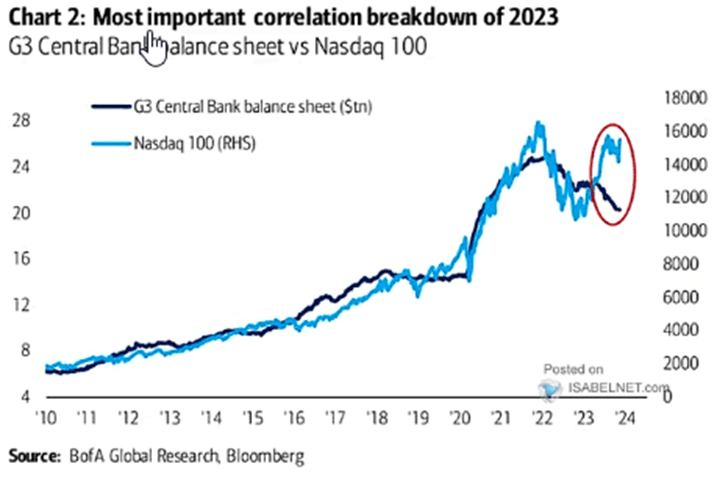
Figure 6 – Gap between NDX and the balance sheets of global central banks.
Subscribe to the Pro Tier to read the rest.
Become a paying subscriber of Market Twists & Turns - Pro to get access to the rest of this post and other subscriber-only content.
Already a paying subscriber? Sign In.
A subscription gets you:
- • In-depth analysis on SPX, NDX, DJI, RUT, VIX/VXX, plus
- • Cryptocurrencies, bonds, commodities, forex, international markets, select stocks, & EFTs
- • Technical & Elliott Wave Analysis (EWA)
- • Price projections using Cycle methods and Fibonacci levels
- • Ad-free & downloadable pdf version

Reply