- Market Twists & Turns
- Posts
- Market Timing and Price Projections
Market Timing and Price Projections
Weekly Newsletter, December 10, 2023
Happy Holidays from BraVoCycles Newsletter! Enjoy a 25% Discount for life when you upgrade to our premium subscription for the holidays.
Table of Contents
Summary
Technical indicators, on both daily and weekly charts, are suggesting that an incredible move up from late October, driven likely by short covering and FOMO is starting to show signs of slowing and potential reversal;
The sentiment indicators are approaching the extreme over-confidence/greed region and one more push in indexes could get it there;
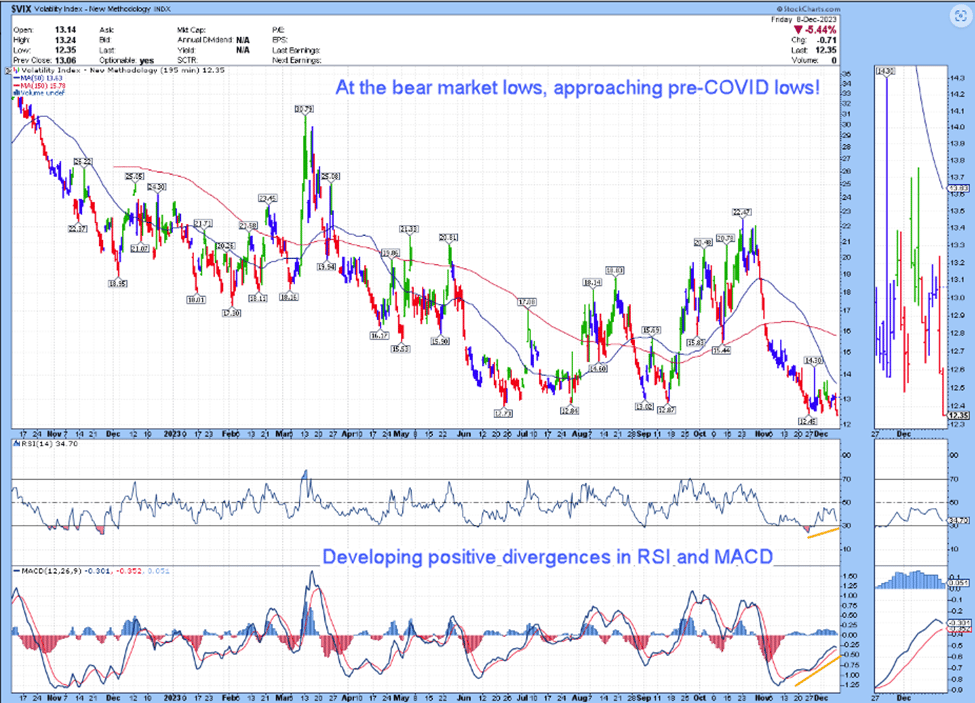
VIX is hitting new lows, at a 5-year low, and is approaching pre-COVID levels. At some point, within a couple of weeks; it should turn up decisively;
Some cycles are turning up while others are expected to turn down. Which ones will win may determine whether we will have a Santa rally or not. Bigger picture multiple cycles should turn down in all indexes this month resulting in a significant cycle peak. We will examine the details more thoroughly further below;
Most indexes still have higher targets allowing for some additional push higher.
USD is oversold and may be due for a bounce.
SPX Technical Analysis
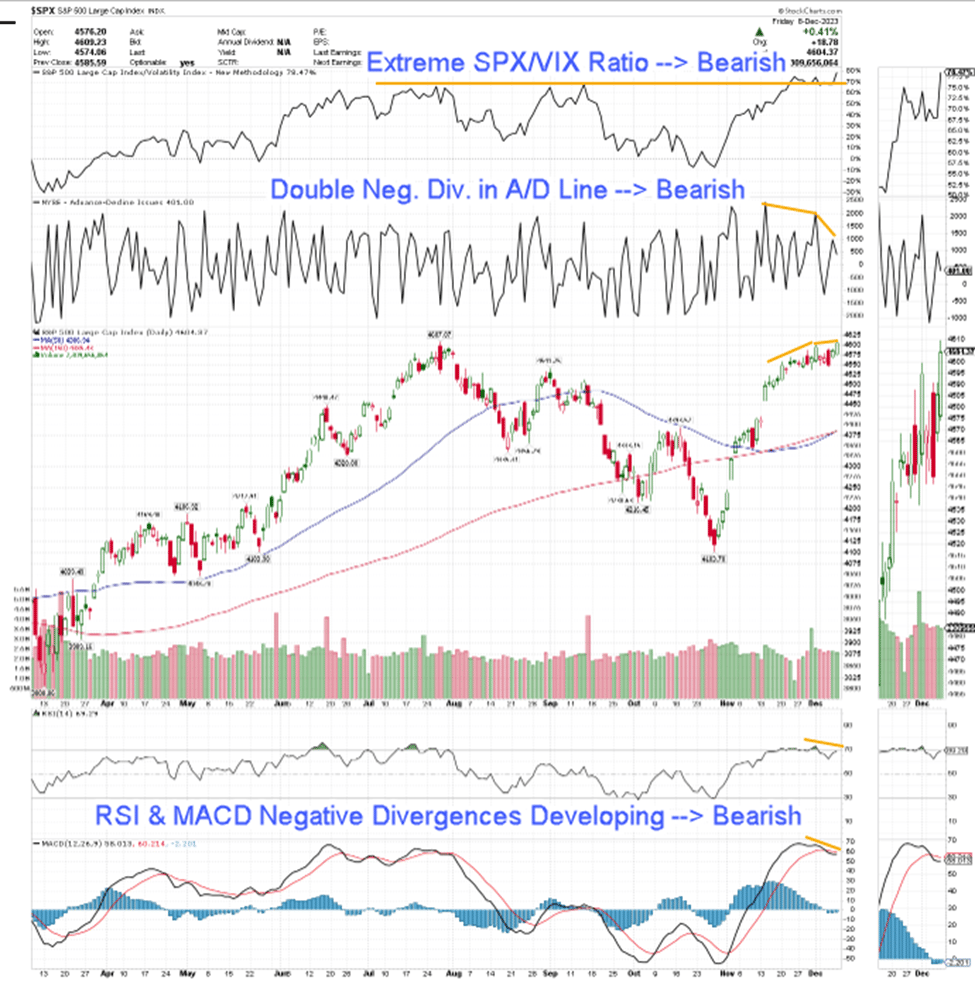
Figure 1 shows SPX and several technical indicators that are flashing yellow/red bearish flags:
SPX/VIX indicator is hitting historic highs (see also the 20-year weekly chart in Tuesday’s intra-week report). This suggests a major bearish reversal within days/weeks;
The NYSE Adv/Dec line ($NYAD) shows an extreme double negative divergence relative to SPX prices;
RSI and AMCD are turning down and are in a position to show negative divergences with SPX reversal, even with some additional push higher.

Figure 1 – Technical picture of SPX.
Sentiment
Sentiment has reached over-confidence levels raising a yellow, if not red flag. Requires caution on the part of investors and traders!
AII bulls approaching Jul’23 levels. Bears are at a 5-year low!
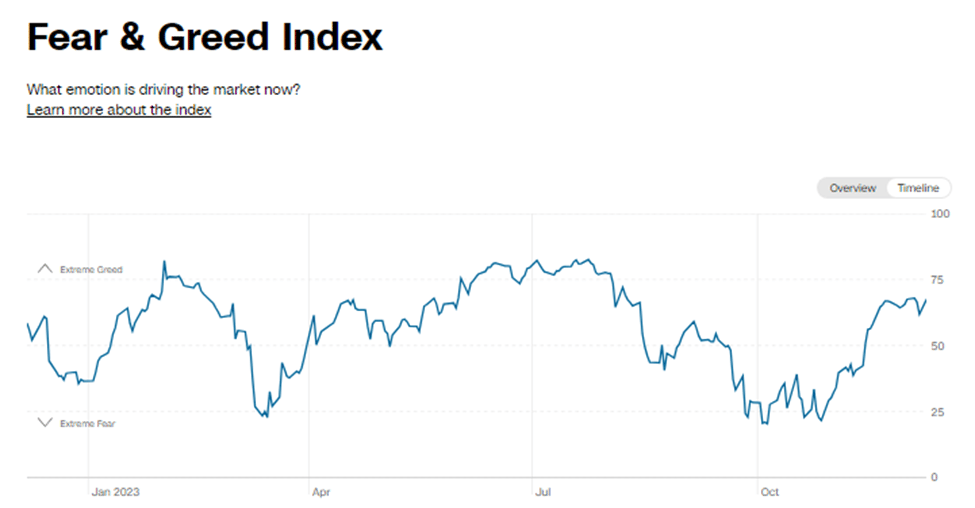
Figure 2 shows that CNN Fear & Greed Index rhymes with the AAII survey, it is approaching extreme greed but not there yet, perhaps some more fuel in the bullish tank.

Figure 2 – CNN Greed & Fear Index.
Figure 2 – CNN Greed & Fear Index.
Figure 3 shows that VIX is bottoming (positive divergences in RSI and MACD), at a bear market low, if still in the bear market. Approaching pre-COVID extremes. Waiting for signs of a reversal.

Figure 3 – VIX 4h chart.
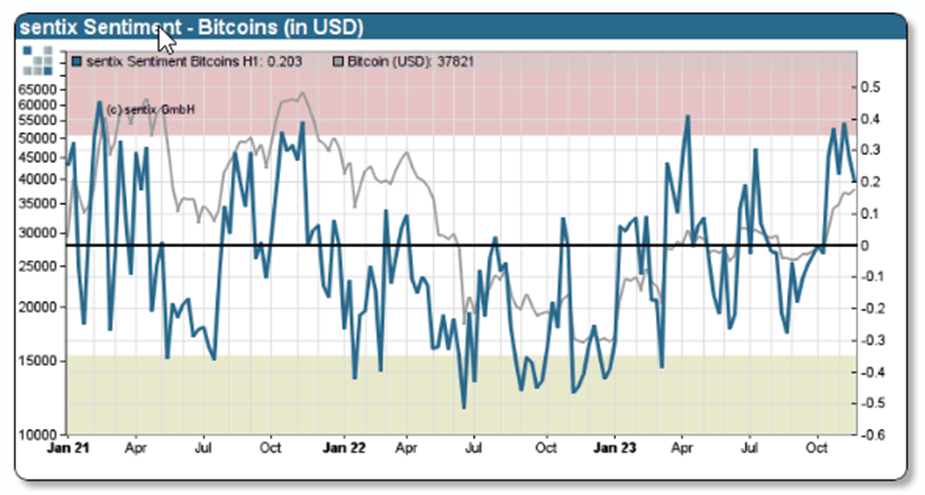
Bitcoin crypto probed twice the over-confidence zone in recent days, calling for caution. Bitcoin could still push somewhat higher but weekly cycles warn that it is due for a multi-month correction.
Subscribe to the Pro Tier to read the rest.
Become a paying subscriber of Market Twists & Turns - Pro to get access to the rest of this post and other subscriber-only content.
Already a paying subscriber? Sign In.
A subscription gets you:
- • In-depth analysis on SPX, NDX, DJI, RUT, VIX/VXX, plus
- • Cryptocurrencies, bonds, commodities, forex, international markets, select stocks, & EFTs
- • Technical & Elliott Wave Analysis (EWA)
- • Price projections using Cycle methods and Fibonacci levels
- • Ad-free & downloadable pdf version


Reply