- Market Twists & Turns
- Posts
- Market Survived Musk-Trump Stock Dump
Market Survived Musk-Trump Stock Dump
US-China Tariff Talks on Monday – Is the US “A Bull in A China Shop?”
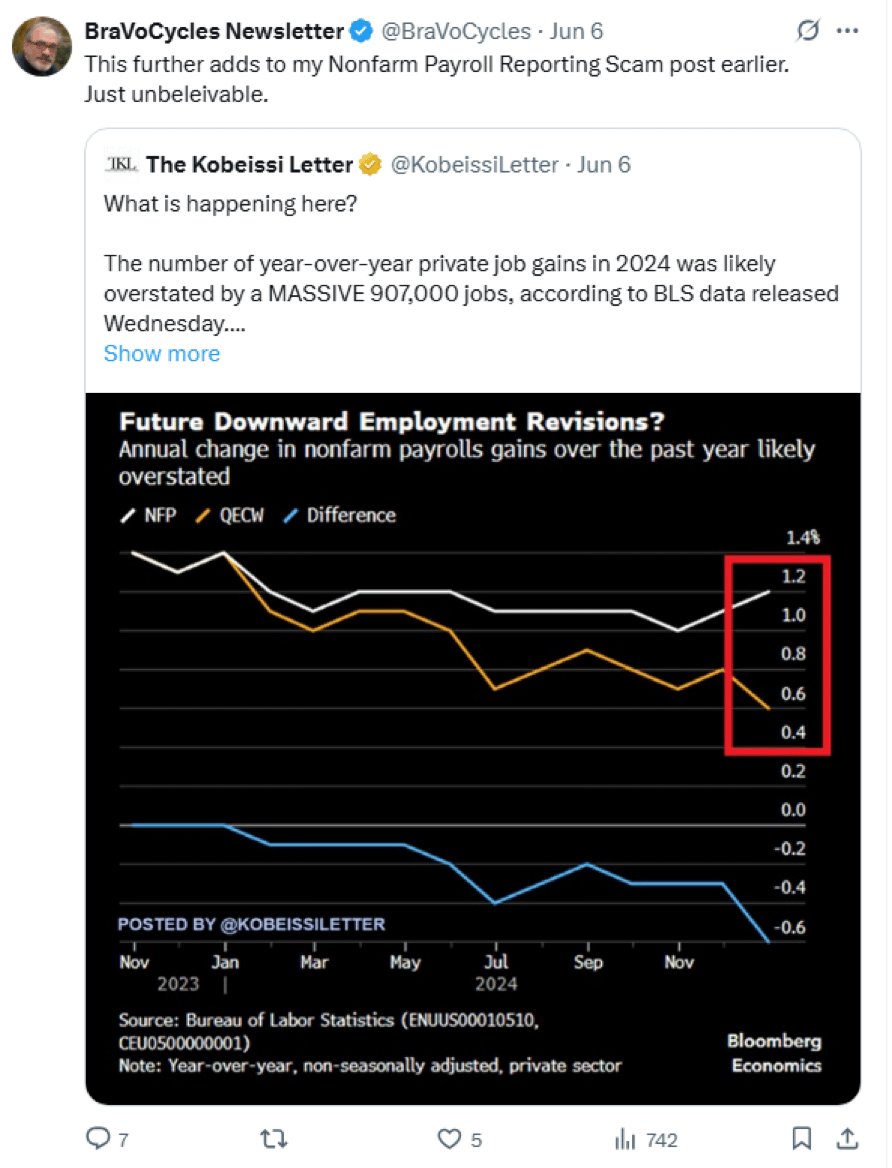
BraVoCycles Newsletter
June 08, 2025
Hey Market Timer!
Stop Missing Out on Market Opportunities: Get 95% Off Your First 3 Months of Market Twists & Turns Pro!

Unlock exclusive insights and expert analysis to maximize your investment returns. For a limited time, get 95% off for your first 3 months and see how our premium content can help you profit in any market.
*Please be advised that this subscription will automatically renew. This subscription renews at the full price after the end of the promotion period. Cancellation is the responsibility of the subscriber.
Today we will be covering...

Today, we will discuss some issues about the US financial institutions.
The Pro newsletter is chock-full of important analysis.
We will continue analyzing deep value commodities-related companies and other potential value plays in future newsletters.
Are US Banks Safe
Financials were among the stronger sectors in the last couple of years.
Maybe investors are sensing some long-term tailwinds for financials. E.g., banks do well during inflationary periods.
But what if we get stagflation or deflation? Well, I will not venture to speculate on this.
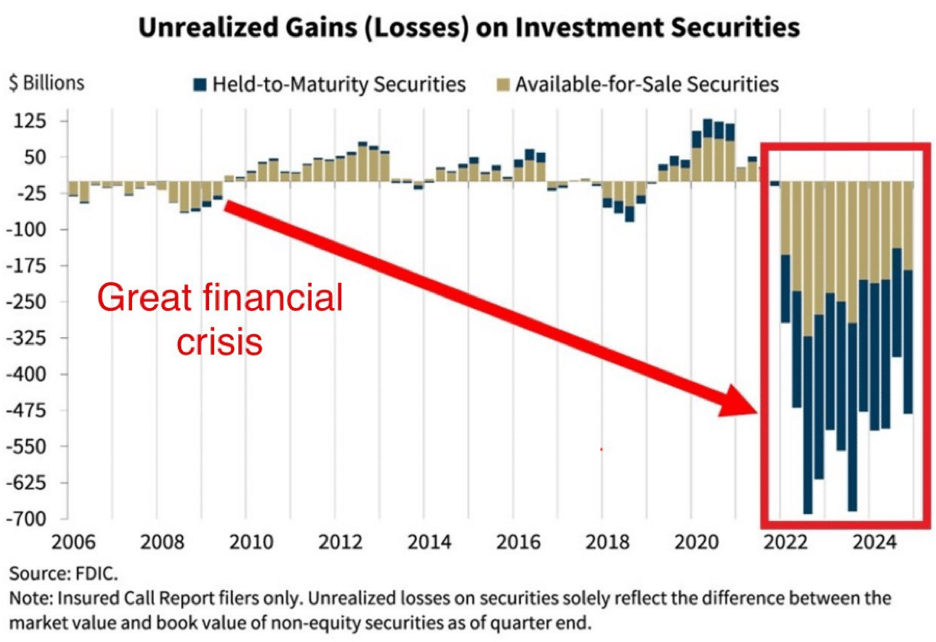
What caught my attention is the chart below showing unrealized gains for financial institutions in the US. And the US is not an isolated case.
What if some of these unrealized losses become unsustainable losses and we get another “Lehman Brothers” moment?
What if the FDIC cannot cover the losses of all FDIC-insured banks? Not predicting that, as it would take an unprecedented financial crisis, a black swan event, to threaten the FDIC’s solvency.
In the next newsletter we will look at cycles of some of the financials.
For peace of mind, keeping money in the safest banks would be good.
You can start your research from the list of the five safest banks identified by GROK using a set of criteria.
JPMorgan Chase:
Why Safe: Ranked #1 by Forbes for 2025, earning a perfect score due to massive asset size ($3.46 trillion, largest in the U.S.), high capital requirements, and robust security (multi-factor authentication, fraud alerts, debit card locking). Listed on the 2024 G-SIB list, ensuring systemic importance and government backing.
Key Features: Over 4,700 branches, 15,000 ATMs, and a top-rated mobile app (4.7/5 stars). Received $10 billion in 2008 bailout, underscoring federal support.
Critique: High fees and complex account structures may offset safety for some consumers. G-SIB status implies “too big to fail,” but systemic risk persists (web result:).
Bank of America:
Why Safe: Ranked just below Chase on the 2023 G-SIB list and the Federal Reserve’s largest banks list, with $2.59 trillion in assets. It offers strong security (unusual activity alerts, multi-factor authentication, and debit card locking, but no virtual card numbers). High consumer sentiment for stability.
Key Features: 3,669 branches, 70,000 ATMs, and virtual assistant Erica for financial management. Competitive 0.04% APY on premium accounts.
Critique: Lacks virtual card numbers, a minor security gap. Higher fees than online banks, but its size and 2008 bailout ($10 billion) ensure resilience.
Wells Fargo:
Why Safe: Third-largest U.S. bank with $1.71 trillion in assets, part of the “Big Four.” Offers FDIC insurance, data encryption, and debit card blocking. Strong for small business banking with tailored checking accounts.
Key Features: 4,227 branches, $1.68 trillion domestic assets (99%), and integrated merchant services. Received $10 billion in 2008, reinforcing stability.
Critique: Past scandals (e.g., fake accounts) dent reputation, but asset size and federal backing mitigate failure risk. Less competitive APYs (web result:).
Citibank (Citigroup):
Why Safe: Fourth-largest bank with $1.70 trillion in assets, 62% domestic. G-SIB status and $10 billion 2008 bailout highlight systemic importance. Offers security features like voice verification and two-factor authentication.
Key Features: 649 U.S. branches, high-yield savings, and global reach (110 foreign branches). Diverse products (CDs, credit cards) enhance stability (web result:).
Critique: Smaller domestic branch network and international exposure increase risk slightly. Still, FDIC insurance and asset size ensure safety (web result:).
M&T Bank Corporation:
Why Safe: Regional bank with $295 billion in assets, notable for stability. One of only two banks not to lower dividends during 2007–2008, profitable every quarter since 1976. Offers security features like debit card blocking and two-factor authentication.
Key Features: Over 1,000 branches in 15 states, fee-free EZChoice checking, and Zelle integration. Strong customer service reputation (web result:).
Critique: Smaller than national giants, but consistent profitability and regional focus reduce systemic risk. Less digital innovation than Chase or Bank of America.
Critical Analysis
Criteria: Forbes’ methodology (web result:) emphasizes G-SIB status (40%), asset size (30%), digital security (10%), and fraud protection (10%), prioritizing systemic importance. All banks are FDIC-insured up to $250,000 per depositor, per account type, a critical safety net. M&T’s inclusion reflects regional stability, balancing the “too big to fail” narrative.
Recent Failures: Six U.S. banks failed in 2023–2025 (e.g., Silicon Valley Bank, Republic First, Pulaski Savings, web result:), highlighting regional vulnerabilities. Large banks like Chase and Bank of America are safer due to asset depth and federal support.
Trade-Offs: Safest banks often have higher fees and lower APYs (e.g., Chase vs. Ally’s 3.60% APY, web result:) compared to online banks, which didn’t make Forbes’ list due to smaller size (web result:). Consumers prioritizing yield may sacrifice safety.
Sentiment & Technical Analysis
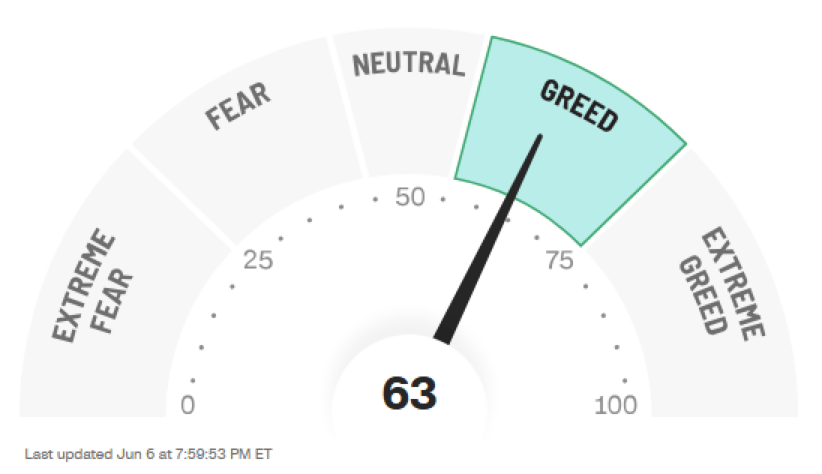
The CNN’s Fear & Greed Index is back in Greed. A few more days market strength could bring the FGI close to Extreme Greed.
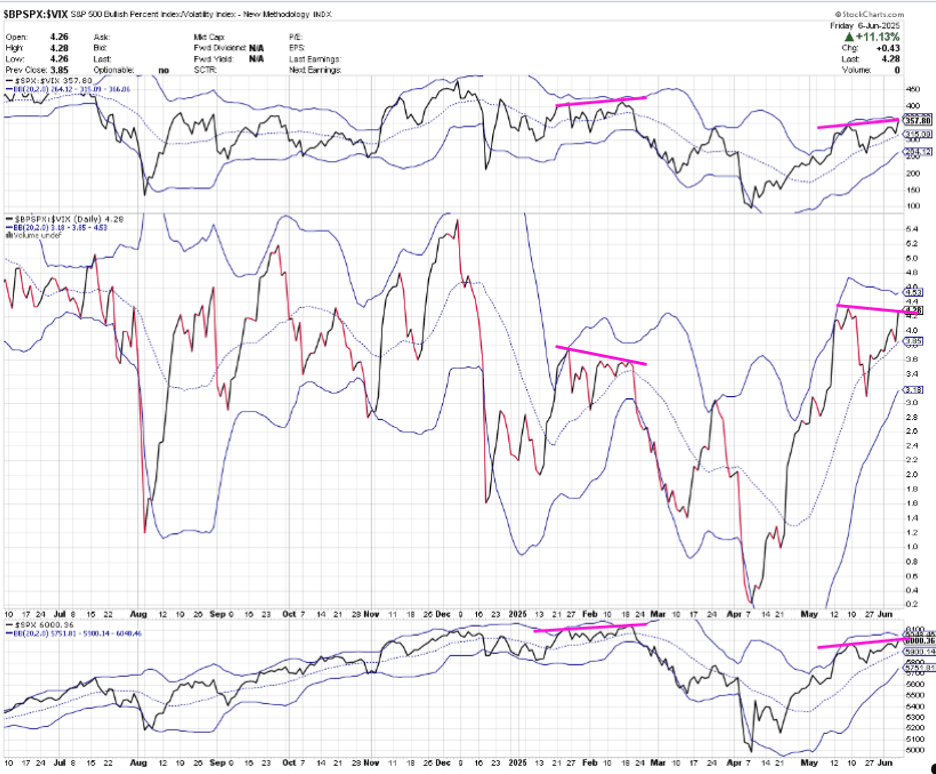
The chart below shows Bollinger Bands (BBs) for 1. SPX/VIX (top);2. BPSPX/VIX, i.e., SPX Bullish Percentage over VIX (mid), and 3. SPX (bottom).
BBs are often used to identify overbought and oversold conditions for financial instruments.
Many use SPX/VIX to identify SPX overbought and oversold conditions and its possible reversal.
BPSPX/VIX may serve better to “predict” SPX reversals as negative divergences in this ratio often, but not always, correspond to SPX tops of sorts.
Right now, there is a potential room for negative divergence, but BPSPX/VIX must roll over before exceeding May’s peak.
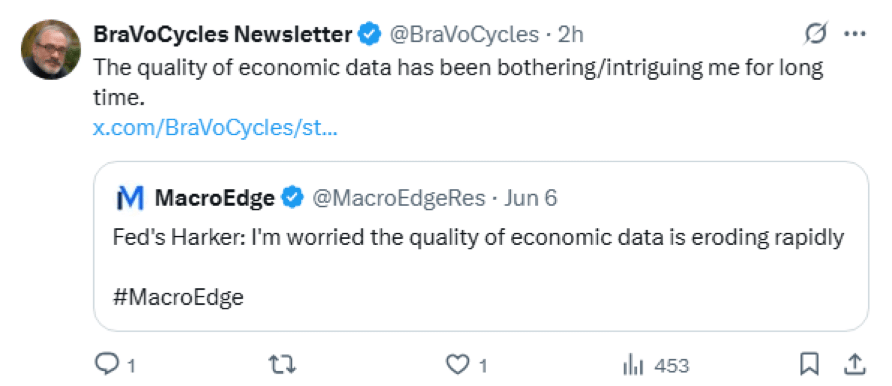
BraVoCycles on X
Consider following me on X (former Twitter) in addition to the newsletter, as I often post valuable information there in real time between the newsletters.

To continue reading about Market Summary, US Markets, Elliott Wave and Technical analysis of US Markets, volatility, as well as commodities, bonds, forex, currencies or crypto, upgrade to Premium Pro. . .
Subscribe to the Pro Tier to read the rest.
Become a paying subscriber of Market Twists & Turns - Pro to get access to the rest of this post and other subscriber-only content.
Already a paying subscriber? Sign In.
A subscription gets you:
- • In-depth analysis & analysis multiple times/week on SPX, NDX, DJI, RUT, VIX/VXX, plus
- • Bonds, commodities, forex, international markets, select stocks, & EFTs
- • Technical & Elliott Wave Analysis (EWA)
- • Price projections using Cycle methods and Fibonacci levels
- • Ad-free & downloadable pdf version
Reply