- Market Twists & Turns
- Posts
- Market is Not Far From Targets
Market is Not Far From Targets
When Price Meets Time
Hey Market Timer!
Do you Want to Feel Like a Smart Investor?
The Premium Newsletter provides key information about the stock market’s trends that you need to know.

Golden insights about the Stock Market, Commodities, Crypto, Bonds & Forex, several times a week.
Upgrade to Premium at a rock bottom promotional price of $29/month.
Today we will be covering...
We’d like to take break in our “regularly scheduled programing” to say Thank You for your responsiveness to our sponsors’ and partner ads, it greatly helps us publish this newsletter for free.
Today we have a message from: 1440 Media
If you're frustrated by one-sided reporting, our 5-minute newsletter is the missing piece. We sift through 100+ sources to bring you comprehensive, unbiased news—free from political agendas. Stay informed with factual coverage on the topics that matter.
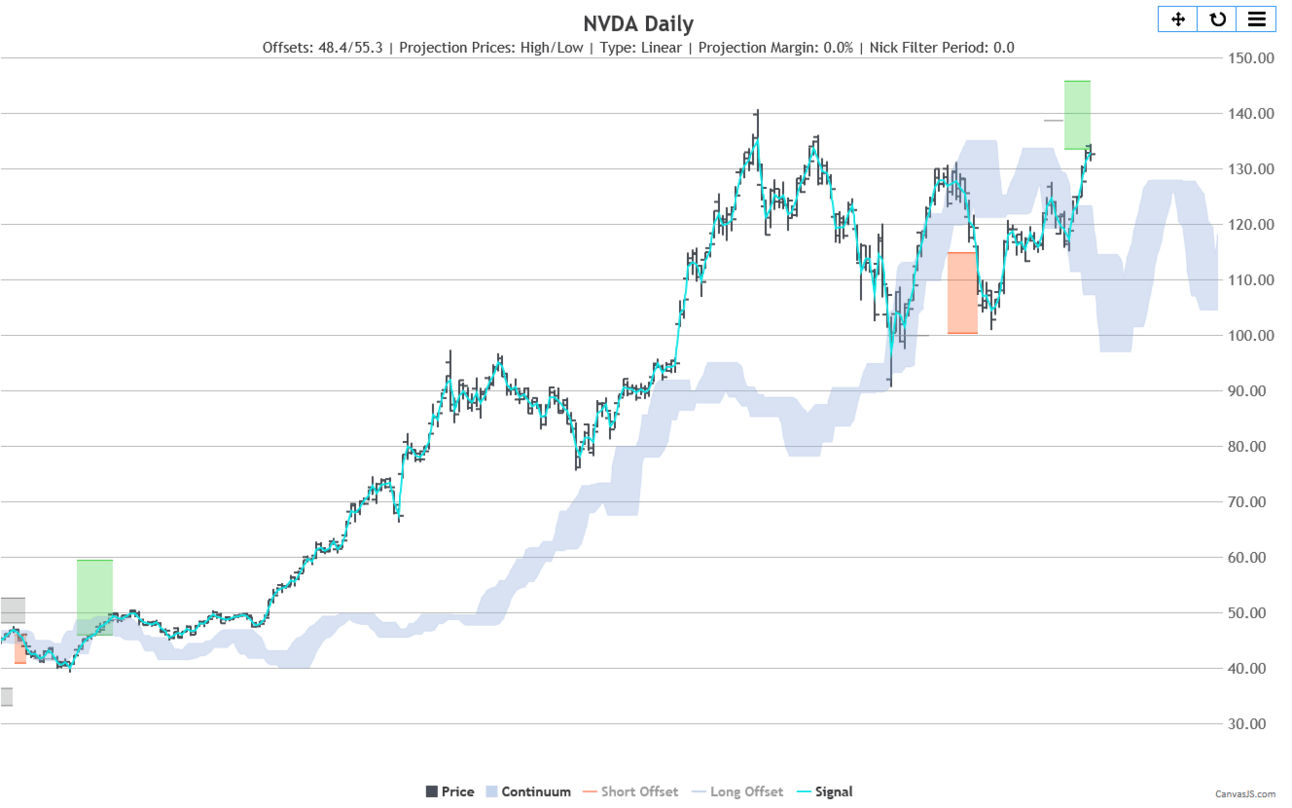
NVDA - Price
The chart below shows NVDA price target of 140+/-5.5, approximately, for the 20-weak (20W) cycle. Essentially, targeting a double top +/-.
This is the highest available target, and it is already minimally satisfied, but NVDA is “allowed” to move higher toward the upper range of the target region.
Sometimes, “hot” stocks may even exceed the target.

NVDA - Time
The chart below shows the 20W cycle in time, which dominates the daily chart and has a period of 81 trading days (TDs).
Just as the price target allows for higher, so the cycle peak allows for more upside bias in the next 1-2 weeks.
In our cycle analysis, we tend to look for reversals when the “price meets time,” i.e., when the price target for a cycle is achieved coincidentally with the estimated cycle turning point.

The chart below shows the cycle composite when we add the three next strongest cycles detected for the daily NVDA chart.
We can see that turning points in time do not change noticeably. This is because the 20W cycle dominates.
Since NVDA is highly correlated with SOX (Semiconductor Index), we can expect a reversal in SOX and SMH at about the same time.
As I mentioned before, SOX, a previous market leader, will likely also impact NDX and SPX.

Consider following me on X (former Twitter) in addition to the newsletter, as I often post valuable information there in real time between the newsletters.
My Post from yesterday is below.
SPX is exhibiting multiple wedges, i.e., wedges within wedges from short-term to very long-term.
Rising wedges, when broken downwards, are bearish in character. When the down-trendline of a rising wedge is broken, it signals a trend reversal from up to down.
Similarly, for falling edges, when the upper trendline is broken to the upside, it signals a trend reversal from down to up.
Of special interest in my X post below is the orange 25-year-long wedge.
Right now, SPX is “flirting” with its upper trendline connecting the 2000 and 2022 SPX peaks. This trendline now represents resistance, and SPX is slightly poking above it.
The lower trendline is some 30% lower and may eventually provide support in a bear market.
However, if the lower trendline is broken, watch out below. Such an event will signal a decade-long bear market.
#SPX wedges; a wedge within wedge, within a wedge ...
25-year long orange wedge in $SPX has 1-2 decade significance. Once the lower trendline is broken, watch out below.
#SPY $SPY #ES $ES #stockmarkets#StockMarket#stockmarketcrash— BraVoCycles Newsletter (@BraVoCycles)
4:45 PM • Oct 9, 2024
To continue reading about Market Summary, US Markets, Elliot Wave and Technical analysis of US Markets, volatility, as well as commodities, bonds, forex, currencies or crypto, upgrade to Premium Pro. . .
Interested in learning how we make our charts? The answer is Motivewave.
An excellent charting software makes a big difference. I tried virtually all of them, but I have been using MotiveWave for the past 15 years.
MotiveWave is an easy-to-use full-featured professional charting, analysis and trading platform. Whether you're new to trading or an experienced trader, MotiveWave was built for you, the individual trader. Advanced strategy analysis tools, like Elliott Wave, Fibonacci, Harmonics, Gartley, and Gann, as well as Volume and Order Flow Analysis tools help you find key points for entering and exiting the market. Support for multiple brokers and data service providers, multiple ways to place trades, hundreds of built-in indicators, built-in strategies, trade simulation, full strategy backtesting and optimization, advanced Replay Mode, and pattern matching algorithm scanners are just some of the features you'll find in MotiveWave.* Get your free 14 day trial now!
Subscribe to Pro to read the rest.
Become a paying subscriber of Pro to get access to this post and other subscriber-only content.
Already a paying subscriber? Sign In.
A subscription gets you:
- • All the benefits of our Entry and Basic tiers, plus
- • Daily updates and opportunities (5x/week)
- • International markets and Forex
- • Cryptocurrencies
- • Bonds and Commodities
- • Individual major stocks and ETFs


Reply