- Market Twists & Turns
- Posts
- Is Stock Market Running Out of Steam?
Is Stock Market Running Out of Steam?
Are Investors Betting that Israel-Iran Conflict Will End Soon?
BraVoCycles Newsletter
June 17, 2025
Hey Market Timer!
Bring Real AI Skills to the Table

The AI for Business & Finance Certificate Program from Wall Street Prep + Columbia Business School Exec Ed offers hands-on training to:
📊 Build models
⚙️ Automate tasks
🔎 Analyze data
…all guided by Columbia Business School faculty.
You’ll also hear from guest speakers at BlackRock, Morgan Stanley, and OpenAI.
P.S. Save $300 with code SAVE300
Today we will be covering...

Today, we will examine some SPX technical indicators in more detail.
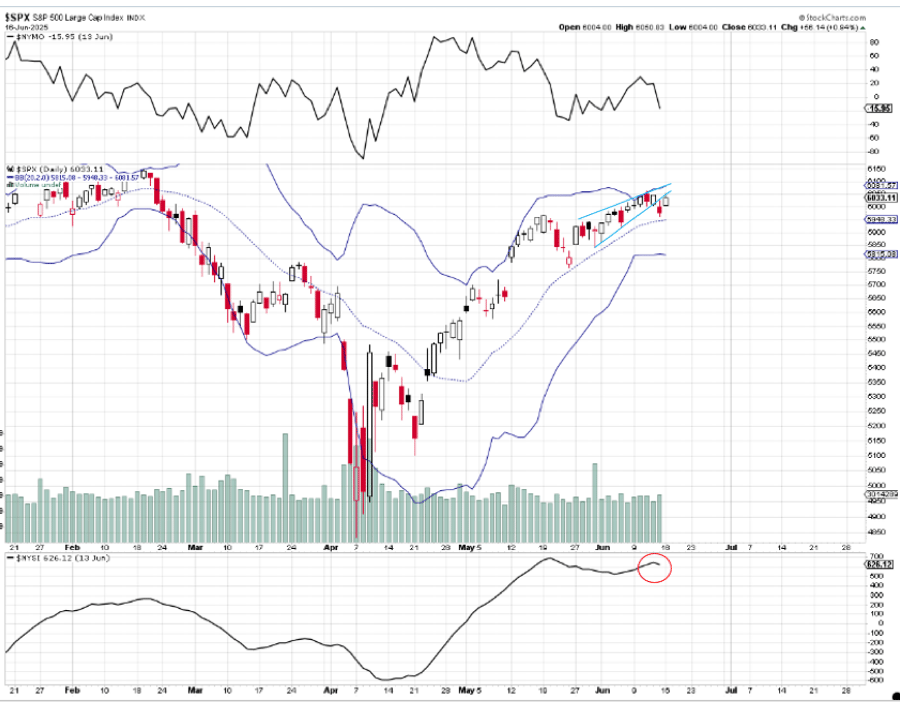
SPX vs NYMO & NYSI
NYSE McClellan Oscillator (NYMO) was weak on a seemingly strong SPX day.
The NYSE McClellan Summation Index (NYSI) curled down.
These indicators suggest week market internals despite the price strength.
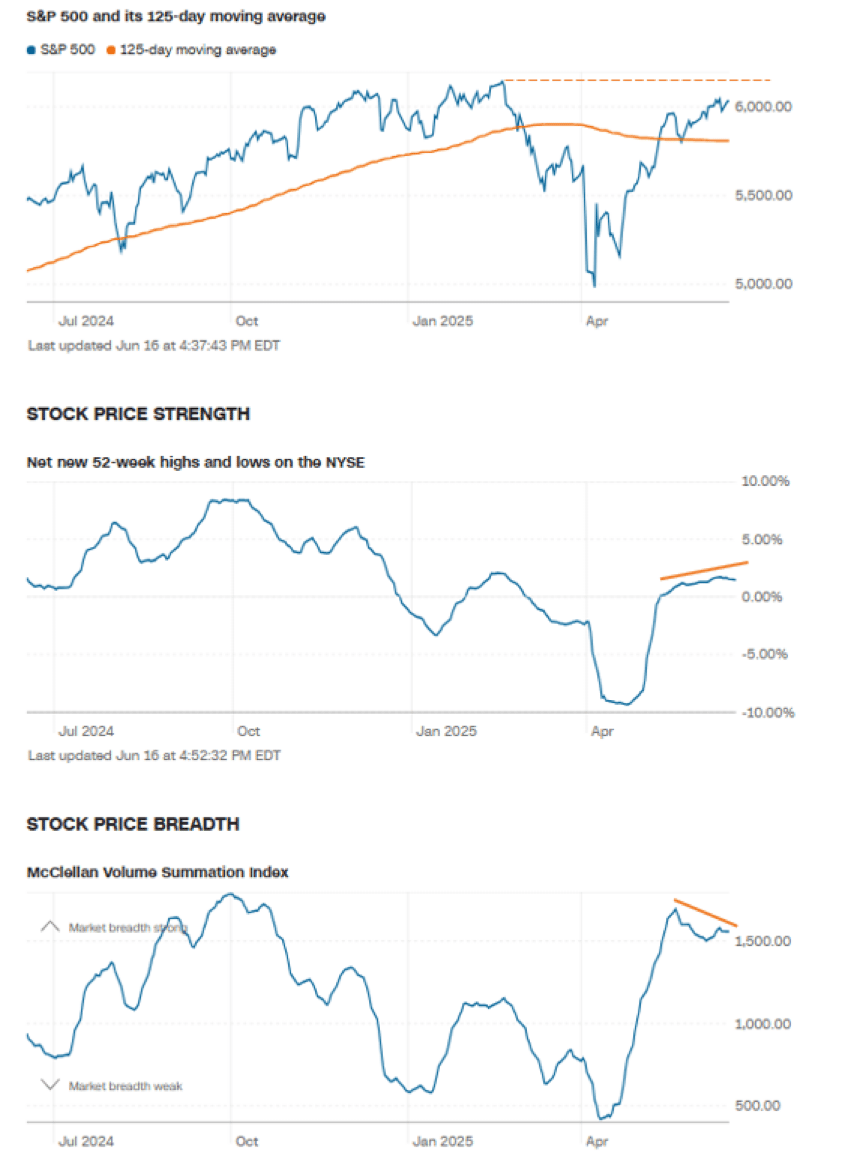
Sentiment & Technical Analysis
The CNN’s Fear & Greed Index improved slightly from 59 to 62, still in Greed.
The Net New 52 Highs & Lows and the McClellan Volume Summation Index both curled down.
The latter is negatively diverging from the former.
This condition in the past often signaled a pending trend reversal in SPX.
Does this mean that SPX cannot still push higher? Of course not, but it suggests that the push is running out of steam.
BraVoCycles on X
Consider following me on X (former Twitter) in addition to the newsletter, as I often post valuable information there in real time between the newsletters.
To continue reading about Market Summary, US Markets, Elliott Wave and Technical analysis of US Markets, volatility, as well as commodities, bonds, forex, currencies or crypto, upgrade to Premium Pro. . .
Subscribe to the Pro Tier to read the rest.
Become a paying subscriber of Market Twists & Turns - Pro to get access to the rest of this post and other subscriber-only content.
Already a paying subscriber? Sign In.
A subscription gets you:
- • In-depth analysis & analysis multiple times/week on SPX, NDX, DJI, RUT, VIX/VXX, plus
- • Bonds, commodities, forex, international markets, select stocks, & EFTs
- • Technical & Elliott Wave Analysis (EWA)
- • Price projections using Cycle methods and Fibonacci levels
- • Ad-free & downloadable pdf version
Reply